Rabu, 30 September 2009

Overview Of The Google Analytics Platform And API


In the previous two videos from the API team, tech lead Jacob Matthews discussed What Is the Google Analytics API and Steps To Using the Google Analytics API.

In our third video, we turn to Ruth Doane, another Tech Lead, to take a step back and look under the hood of Google Analytics itself. Did you ever wonder how data is collected and organized in Google Analytics? See what happens to traffic data after it is sent to Google Analytics and learn how it gets processed and stored, and then ends up in the Web Interface and Custom Reporting.

And best of all, learn how the API works with your data, and how it puts you are in the driver seat. Enjoy!

Selasa, 29 September 2009

Advanced: Structure Your Account With Roll Up Reporting And More

Guest post by the team at E-Nor, a Google Analytics Authorized Consultant

For the analytics ninjas out there, you know that data accuracy is probably one of the most challenging aspects of analytics across all solutions and platforms, and you learn to apply best practices and establish processes to improve data collection and reporting.

But for the rest of us, how do we help marketers, business owners, and webmasters have confidence in their data? Analytics is all about clarity. It should help you see actionable statistics clearly and quickly. However, when you have a website structure with multiple domains and subdomains - which is often the case - sometimes things can get jumbled.

For instance, you are a CMO or a Director of Marketing at the enterprise and you are responsible for the performance and ROI of a large number of web proprieties. You look at your analytics reports and you can't find your ecommerce data from site A, site B is referring traffic to itself (definitely not a good thing!), and conversion data from your marketing campaign microsite is no where to be found.

This image sums up the feeling.

No need to panic. This post aims to offer an approach to help you plan your Google Analytics accounts setup in a structured fashion to help with clarity. I hope that by following the approach and the technical steps, you will be able to collect and manage all your data, make more sense of it, and most importantly, ensure what you are reporting on, trending, dashboarding and analyzing is based on accurate data.

There are two distinct sections of this post:

  • The Strategy (non-technical)
  • The How (technical)

The Strategy

There are many ways to structure your Google Analytics profiles when you have multiple domains and subdomains. But in this post I will limit myself to the one that I like the most and I believe is the least confusing.

Before I go into details of the solution, and for simplification, let us assume we are dealing with a pr
oject that has the following requirements:
  • A business with 3 domains (www.a.com, www.b.com, and www.c.com)

  • 1 domain (a.com) links to a 3rd party shopping cart (www.mystore.com)

  • 2 domains (a.com and b.com) have multiple sub-domains

Here is a graphical representation of the structure:

Measurement Requirements
  • Track each domain and sub-domain separately (e.g. www.a.com, news.a.com, and blog.b.com)

  • Track the rollup/overall traffic for all domains and sub-domains

  • Track full e-commerce transactions

Solution
  • Create a Google Analytics account for each domain (www.a.com, www.b.com, and www.c.com)

  • Customize the tracking code to link the multiple sub-domains with their main domains

  • Link the third party shopping cart with the main domain and install Google Analytics tracking code in all shopping pages

  • Create a rollup Google Analytics account and add its code to all domains and sub-domains
Graphical example of a well-planned Analytics Account Structure:

Now on to the technical stuff. If you don't enjoy javascript and regular expressions, you may stop here and ask your webmaster or technical analyst to read further :-)


The How:

I will try to illustrate the technical implementation in 10 simple steps:

1- Create a unique Google Analytics account for each domain www.a.com, www.b.com, and www.c.com and then use the account number UA-AAAAAAAA-1 in the code in step 3 and use the accounts UA-BBBBBBBB-1 for www.b.com and UA-CCCCCCCC-1 for www.c.com in the code in step 8.

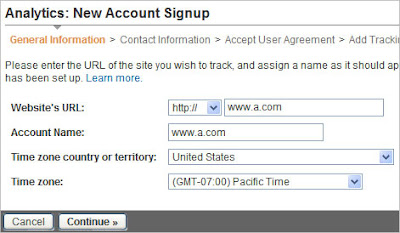
2- Create a Google Analytics account for the a rollup account that will oversee all domains and sub-domains (use the GA account number UA-XXXXXXXX-1 in the code used in step 3 and 8)

3- Add the following Google Analytics tracking code to the main site (www.a.com) and its sub-domains (blog.a.com, news.a.com, images.a.com, and media.a.com)

About the following code: We have a regular pageTracker object to track activity on each particular subdomain and a rollupTracker to track activity across all subdomains and the third party checkout site. (Click here to learn more about the customizations we made to the standard Google Analytics tracking code)

<script type="text/javascript">
var gaJsHost = (("https:" == document.location.protocol) ? "https://ssl." : "http://www.");
document.write(unescape("%3Cscript src='" + gaJsHost + "google-analytics.com/ga.js' type='text/javascript'%3E%3C/script%3E"));
</script>
<script type="text/javascript">
try {
var pageTracker = _gat._getTracker("UA-AAAAAAAA-1");
pageTracker._setAllowHash(false);
pageTracker._setDomainName(".a.com");
pageTracker._setAllowLinker(true);
pageTracker._trackPageview();
var rollupTracker = _gat._getTracker("UA-XXXXXXXX-1");
rollupTracker._setAllowHash(false);
rollupTracker._setDomainName(".a.com");
rollupTracker._setAllowLinker(true);
rollupTracker._trackPageview();
}
catch(err) {}

</script>

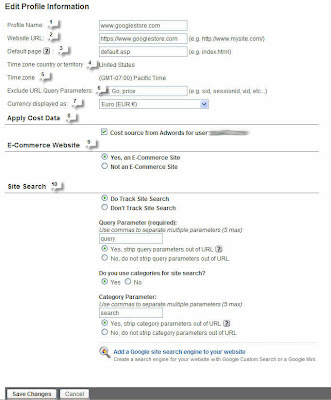
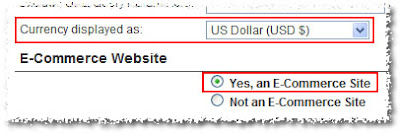
4- Enable E-Commerce Reporting

Analytics Settings > Profile Settings > Edit Profile Information

5- Add the following code* to all shopping cart pages on the store site (www.mystore.com)

*Make sure to add this code to the top of the pages.

<script type="text/javascript">
var gaJsHost = (("https:" == document.location.protocol) ? "https://ssl." : "http://www.");
document.write(unescape("%3Cscript src='" + gaJsHost + "google-analytics.com/ga.js' type='text/javascript'%3E%3C/script%3E"));
</script>
<script type="text/javascript">
try {
var pageTracker = _gat._getTracker("UA-AAAAAAAA-1");
pageTracker._setDomainName("none");
pageTracker._setAllowLinker(true);
pageTracker._trackPageview();
var rollupTracker = _gat._getTracker("UA-XXXXXXXX-1");
rollupTracker._setDomainName("none");
rollupTracker._setAllowLinker(true);
rollupTracker._trackPageview();
}
catch(err) {}

</script>

6- Add the e-commerce tracking code to the confirmation page after the GATC.

Read more about "How to track e-commerce transactions?"

7- Change the links to the store site (www.mystore.com) on the main site (www.a.com) to use _link as following:

If the current link looks like:

<a href="https://www.mystore.com">Buy Now</a>

Change it to:

<a href="https://www.mystore.com" onclick="pageTracker._link(this.href); return false;">Buy Now</a>

8- Repeat step number 3 for domains www.b.com and www.c.com after updating the Google Analytics account number UA-AAAAAAAA-1 and the setDomainName value.

  • To view the entire code for www.b.com and its sub-domains (click here)

  • To view the entire code for www.c.com (click here)

9- Create a profile for each sub-domain (only if needed)

In order to track a sub-domain (ex. blog.b.com) in its own profile, follow the following three steps:

a- Create a filter that include only traffic from Hostname=blog.b.com


b- Create a profile and name it "Blog"

c- Apply the sub-domain filter to the new profile

10-
As you might have noticed from the codes that we added so far to all pages, we added an extra Google Analytics account to track all pageviews across domains and sub-domains to one Google Analytics account. We call this account “rollup account”.

var rollupTracker = _gat._getTracker("UA-XXXXXXXX-1");
rollupTracker._trackPageview();

Since in the rollup account, we will track pages from different sites and many of these pages might share the same naming convention, I suggest that you create an advanced filter that adds the hostname to the page name to differentiate between pages with same URI.

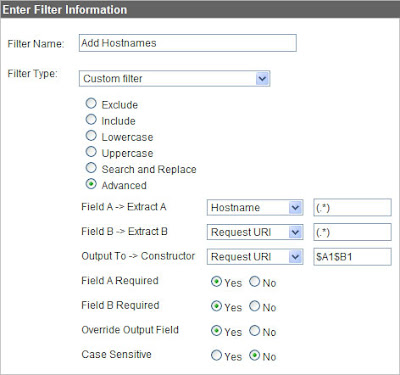
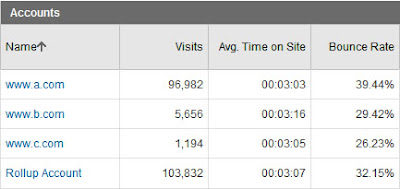
Once you apply the filter, the upcoming data will appear as following:


Note, in the example above if we didn’t apply the “Add Hostnames” filter, all home.aspx pages will appear as one page with 2685 pageviews.

If you have been with us so far, you are now ready to conduct your analysis based on clean and much more accurate data :)
  • To review each domain by itself and for deep-dive analysis, use the domain profiles

  • To get an overview and to see how the business is doing across all sites, use the “Rollup Account”

Related Posts


Senin, 28 September 2009

Back to Basics: What's in a profile setting?

A little known link in your Analytics account is the key to unlocking extra ecommerce functionality in your Google Analytics account. In this post, we'll show you how clicking the 'Edit' link in your Main Website Profile Information box can open doors for your AdWords and ecommerce tracking purposes.


Once you click 'Edit' (highlighted in red above), you'll see a screen with editable fields like the image pictured below. The numbered list corresponds to the number next to each field so that you can learn how to set up a profile and enable the right features for your tracking purposes.


  1. Enter an easily identifiable profile name.
  2. Fill in the web property URL that you are tracking for this profile.
  3. Enter the default page to which your server defaults to when no page on the domain is specified. This information allows Google Analytics to combine requests to www.yourdomain.com and www.yourdomain.com/index.html, which are in fact the same page. If Default page isn't specified, these would be reported as two separate pages.
  4. If your account is linked to an AdWords account, your time zone country and time zone will default to the ones specified in your AdWords account. If your accounts are not linked, you'll see pull-down menus that display options for you to select for #4 and #5.
  5. Same as #4.
  6. If your site uses unique session IDs or other query parameters in your URLs that you are not interested in seeing in your reports, you can easily exclude these parameters by entering them into this field.
  7. Enter the currency you want to see in your reports.
  8. If you have linked an AdWords account, import your cost data so that you can get AdWords information pumped into your Google Analytics account. Once your cost data is imported, the information will appear in the Clicks tab of your AdWords report. Learn how to import your cost data.
  9. If you're tracking e-commerce on your website, you must enable it to be reflected in your reports in this section. If you would like to set up e-commerce for your site, please read this Help Center article.
  10. If you have a search engine on your site, you may want to enable this feature. Site Search contains reports about the visitors using the 'search' functionality on your website. Google Analytics Site Search reports deliver many useful pieces of information - for example, they can help you analyze how people use the search functionality on your site, and report its conversion metrics. Learn how to enable Site Search.

Kamis, 24 September 2009

Fall In Love With Motion Charts


Have you used Motion Charts yet? If not, it's a little like playing an instrument. It takes a little practice, but once you get the hang of it, it's the best thing you ever did - fun and informative and you'll want to do it daily. Create them and watch them reveal patterns you weren't aware of in your keyword activity or some other area that is important to your site.

We've written a few posts on Motion Charts and made a video, and now we wanted to refer you to a great article called How To Use Google Analytics Motion Charts To Maximize Results, on Searchengineland.com, written by one of our Authorized Consultants, Daniel Waisberg from easynet search marketing in Israel.

Daniel discusses both how to use Motion Charts and also what metrics to designate as which elements of the chart to best use the feature for optimizing your online marketing. In his example, Daniel chooses to have conversion values as the size and color of the bubbles so you can easily spot them for optimization opportunities. For instance, for an e-commerce site and a motion chart showing keywords with the y-axis as visits and the x-axis as bounce rate, Daniel says:
Ecommerce conversion rate (color of bubble) shows the conversion rate for a keyword. This is important since you might have high converting keywords that are not receiving enough traffic. Look for red-small bubbles located close to the x-axis—these keywords should get priority optimization treatment. Tip: focus on these and related keywords on your PPC campaigns.

Revenue (size of bubble) shows the amount of money this keyword is driving to your website. Look for big-blue bubbles—this is a signal that a keyword brings lots of money but could bring even more if it converted better. Tip: optimize the pages related to these keywords to improve conversion.
Daniel also goes into detail about how to share motion charts with others. If you're ready to try Motion Charts today, his article is your next step. Then, for more inspiration, here are a few more examples of using them.

Rabu, 23 September 2009

New Video: Steps to Using the Analytics API


Last week, in our Google Analytics API video series, Jacob Matthews discussed What is the Google Analytics API? In this new video, Jacobs goes deeper and describes the three steps developers need to take to retrieve data from Google Analytics: Authentication, Account Query, and Profile/Report Query.

Feeling inspired? Play with our interactive javascript examples to see the API in action.

Senin, 21 September 2009

Back To Basics: Save Clicks, Save Time

Did you know that you can save clicks and jump directly to a deep-level report from your dashboard? Let's say that you want to see which cities in California you get traffic from. Ordinarily, you'd need to click Visitors, then Map Overlay in the report navigation. Then, you'd need to click United States, then California. But, you can save 3 of these 4 clicks by simply adding this report to your dashboard.

Try it now. Go to one of your favorite reports that requires several clicks to access. Once you've arrived at the report you want --and at the level you want it -- click Add to Dashboard. (The Add to Dashboard button is at the top of your report on the left, next to the Export and Email buttons.)


You'll now see the report on your dashboard. The next time you log in to your Analytics account, you'll be able to see the top cities from California on your dashboard and jump right to the report with a single click.


Jumat, 18 September 2009

New Analytics API Features including Event Tracking!

We are excited to be releasing new features -- features that have been prioritized based on feedback from you.

Event Tracking

Get Excited! Event Tracking, our number-one feature request, is available through the API. You can use event tracking to measure the number of user interactions with a website. For example, you can track:
  • the total number of times a white paper is downloaded
  • the length of time it takes to load a video
  • the number of validation errors users get when filling out a form
If you already have an integration with Google Analytics, Event Tracking is even more exciting. To illustrate, let's look at Sprout. Sprout's integration with Google Analytics helps customers track user interaction within their Sprout content. However, users currently must log into the Sprout interface to see billing and account management data, and then also log into Google Analytics to see how their own sprouts are performing. Now that event tracking is available through the API, companies like Sprout can pull the interaction metrics tracked by Google Analytics events and present them directly in clients' performance dashboards--effectively leveraging Google Analytics as a platform to power their analysis reports.

Ready to try out Event Tracking yourself? Check out the event tracking API docs, or fire up the Query Explorer tool.

Navigational data


The Google Analytics web interface provides a navigation report. Analysts use it to infer which links visitors click on, from one particular page to the next. Now that this data is available through the API, you can create new visualizations, such as custom site overlays, to see which links get the most clicks.

Increased filter length

The length of filter expressions has been increased to 128 characters. This enables developers to perform more complex queries with fewer requests to the API, saving bandwidth and quota.

There is a detailed list of all these changes in our public change log. We hope you find these features useful to your development and look forward to your comments and continued feedback. If you haven't done so already, please join our public Google group and let us know how you've been using the API.


Nick Mihailovski

Kamis, 17 September 2009

New Video: What is the Analytics API?


I spent a day in Irvine, California interviewing some of the software engineers who built the Google Analytics API, starting with Jacob Matthews, the tech lead behind the API. If you haven't read any of our API documentation yet but you have been wondering what the Google Analytics API is all about, we put together a couple of videos where we hear about the API from the people who built it. Here is the first one where we keep it high level and ask Jacob, "What is the Google Analytics API?"

Enjoy!

Jumat, 11 September 2009

Using Google Analytics To Identify High-Performing Keywords

The topic of using Google Analytics to optimize your PPC keyword buys never gets old. We have posted about it here a bunch. It's putting your PPC money where your analytics mouth is, uh, for lack of a better metaphor and is one of the core reasons to use web analytics. Recently, a Google blog called Solutions for Southeast Asia wrote a post about this topic, covering the techniques to use Google Analytics and AdWords to find and add the most effective unused keywords. It's a great post - definitive and very thorough, going from soup to nuts, expanding on these steps:

Step 1: Ensure Goals and E-commerce Tracking are set up
Step 2: Access the Keywords Report
Step 3: Export non-paid keywords to a spreadsheet
Step 4: Expand the list of keywords using other Google products
Step 5: Download a list of keywords that you are already advertising on
Step 6: Identify keywords you are not advertising on
Step 7: Expand on these keywords and start advertising


For explicit directions on each of these steps, take a read of the article. You and your website will benefit. Of special note - step 4, which we've pasted in below. As you can see, Vinoaj, the author, gives you an extensive list of Google products that can help you refine or expand your keyword list. Some of them you've probably never even heard about, but will simply take your targeting to the new levels, especially when budgets are tight but you want to grow your business as Q4 approaches.

To consider more keyword options, consider using some of Google's other free products to discover more opportunities: Google Insights for Search, Google Trends, Site Search reportsin Google Analytics, Webmaster Tools, and even the new Wonder Wheel. If you are an AdWords user take a look at the Keyword Tool, Search-based Keyword Tool, Search Query Performance reports, and more. Once you have identified additional keywords you would like to advertise on, add it to your list of keywords from Step 3.

Happy analyzing!

New Job

You can follow me here.

Jumat, 04 September 2009

Episode 3 Of Bottlenecks To Implementation: Should You Use An Agency?


Here is the final episode of our three part series on bottlenecks that companies face implementing web analytics. In this episode, we ask the question, "Should you use an agency, or can you do everything (implementation and analysis) in house?"

Bottom line: you need big brains.

And if you decide to go with one of our authorized consultants, you can find one near you. They are analytics do-everything agencies which often double as SEMs, SEOs, and Website Optimizers so you get the full circle of support for almost everything you do online - including strategic recommendations on improving your web presence and marketing.

Selasa, 01 September 2009

Episode 2: Bottlenecks To Implementation For SMBs


The first episode in the three part "Data Driven Discussion" series about bottlenecks to implementation focused on large, enterprise-class companies. In this episode, we ask our experts Nick and Avinash the question, "What obstacles does a small-to-medium sized business face in implementing analytics?"

SMBs are often more nimble than large businesses but resource-constrained with everyone working overtime. A lot is at stake. In this environment, analytics can have a huge impact, answering questions and giving guidance through data to back up major decisions.