This widget also auto-detect your blog language and then translate it to the readers chosen language.
It supports 12 different languages:
English, French, German, Spanish, Italian, Dutch, Portuguese, Russian, Japanese, Korean, Arabic And Chinese.

How To Add The Google Translate Widget To Blogger
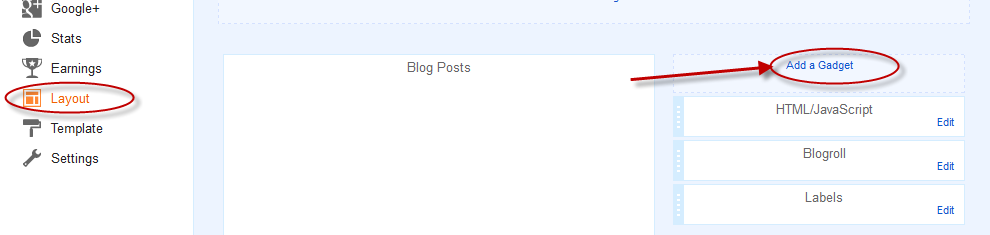
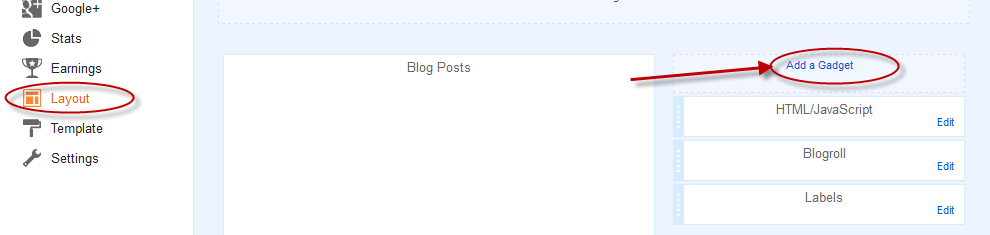
Step 1. Go to your Blogger Dashboard >> Layout and click on "Add A Gadget" link
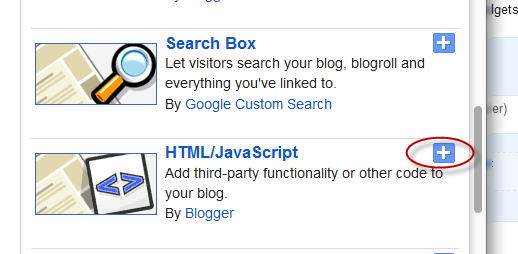
Step 2. From the pop-up window, scroll down and choose HTML/JavaScript

Step 3. Paste the code below in the empty box:
<script type="text/javascript">
function showHide(shID) {
if (document.getElementById(shID)) {
if (document.getElementById(shID+'-show').style.display != 'none') {
document.getElementById(shID+'-show').style.display = 'none';
document.getElementById(shID).style.display = 'block';
}
else {
document.getElementById(shID+'-show').style.display = 'inline';
document.getElementById(shID).style.display = 'none';
}
}
}
</script>
<style>
.google_translate img {
margin: 10px 20px 0px 20px;
height: 24px;
width: 24px;
}
.google_translate:hover img {
filter:alpha(opacity=0.30);
-moz-opacity: 0.30;
opacity: 0.30;
border:0;
}
.more {
display: none;
a.showLink, a.hideLink {
text-decoration: none;
color: #0880C4;
padding-left: 18px;
background: transparent('down.gif') no-repeat left; }
a.hideLink {
background: transparent url('up.gif') no-repeat left;
color: #0880C4;}
a.showLink:hover, a.hideLink:hover {
color: #0880C4;
}
</style>
<div>
<a class="google_translate" href="#" target="_blank" rel="nofollow" title="English" onclick="window.open('http://translate.google.com/translate?u='+encodeURIComponent(location.href)+'&langpair=auto%7cen&hl=en'); return false;"><img alt="English" border="0" align="absbottom" title="English" height="24" src="http://1.bp.blogspot.com/-sXhoGx5s2dg/T5xOeRCOuYI/AAAAAAAAARo/ldYJIGQldwQ/s1600/United+Kingdom(Great+Britain).png" style="cursor: pointer;margin-right:8px" width="24"/></a>
<a class="google_translate" href="#" target="_blank" rel="nofollow" title="French" onclick="window.open('http://translate.google.com/translate?u='+encodeURIComponent(location.href)+'&langpair=auto%7cfr&hl=en'); return false;"><img alt="French" border="0" align="absbottom" title="French" height="24" src="http://2.bp.blogspot.com/-aklFaq6pPeQ/T5xOV1mPbcI/AAAAAAAAARg/CcBmt1ptN88/s1600/France.png" style="cursor: pointer;margin-right:8px" width="24"/></a>
<a class="google_translate" href="#" target="_blank" rel="nofollow" title="German" onclick="window.open('http://translate.google.com/translate?u='+encodeURIComponent(location.href)+'&langpair=auto%7cde&hl=en'); return false;"><img alt="German" border="0" align="absbottom" title="German" height="24" src="http://1.bp.blogspot.com/-nX0ktPsJQTA/T5xOMiiOGQI/AAAAAAAAARY/VXhAPARvh9E/s1600/Germany.png" style="cursor: pointer;margin-right:8px" width="24"/></a>
<a class="google_translate" href="#" target="_blank" rel="nofollow" title="Spain" onclick="window.open('http://translate.google.com/translate?u='+encodeURIComponent(location.href)+'&langpair=auto%7ces&hl=en'); return false;"><img alt="Spain" border="0" align="absbottom" title="Spain" height="24" src="http://4.bp.blogspot.com/-QPXkbtHOD4c/T5xODxO-FVI/AAAAAAAAARQ/1jye5k8T0DI/s1600/Spain.png" style="cursor: pointer;margin-right:8px" width="24"/></a><a href="#" id="example-show" class="showLink"
onclick="showHide('example');return false;">More</a>
<div id="example" class="more">
<a class="google_translate" href="#" target="_blank" rel="nofollow" title="Italian" onclick="window.open('http://translate.google.com/translate?u='+encodeURIComponent(location.href)+'&langpair=auto%7cit&hl=en'); return false;"><img alt="Italian" border="0" align="absbottom" title="Italian" height="24" src="http://3.bp.blogspot.com/-0QwKU5U8K2k/T5xN5VZK2tI/AAAAAAAAARI/SvXac8-EQEg/s1600/Italy.png" style="cursor: pointer;margin-right:8px" width="24"/></a>
<a class="google_translate" href="#" target="_blank" rel="nofollow" title="Dutch" onclick="window.open('http://translate.google.com/translate?u='+encodeURIComponent(location.href)+'&langpair=auto%7cnl&hl=en'); return false;"><img alt="Dutch" border="0" align="absbottom" title="Dutch" height="24" src="http://4.bp.blogspot.com/-vJtqiSEPK0A/T5xNup0Q3vI/AAAAAAAAARA/SyuRn3jZjgk/s1600/Netherlands.png" style="cursor: pointer;margin-right:8px" width="24"/></a>
<a class="google_translate" href="#" target="_blank" rel="nofollow" title="Russian" onclick="window.open('http://translate.google.com/translate?u='+encodeURIComponent(location.href)+'&langpair=auto%7cru&hl=en'); return false;"><img alt="Russian" border="0" align="absbottom" title="Russian" height="24" src="http://2.bp.blogspot.com/-Em4KegbEBmk/T5xNjs5f_NI/AAAAAAAAAQ4/yLtUCDesqGs/s1600/Russian+Federation.png" style="cursor: pointer;margin-right:8px" width="24"/></a>
<a class="google_translate" href="#" target="_blank" rel="nofollow" title="Portuguese" onclick="window.open('http://translate.google.com/translate?u='+encodeURIComponent(location.href)+'&langpair=auto%7cpt&hl=en'); return false;"><img alt="Portuguese" border="0" align="absbottom" title="Portuguese" height="24" src="http://2.bp.blogspot.com/-IVx5Fq_02dE/T5xNZIbiHzI/AAAAAAAAAQw/dvI6mI6z3Dw/s1600/Brazil.png" style="cursor: pointer;margin-right:8px" width="24"/></a>
<br />
<a class="google_translate" href="#" target="_blank" rel="nofollow" title="Japanese" onclick="window.open('http://translate.google.com/translate?u='+encodeURIComponent(location.href)+'&langpair=auto%7cja&hl=en'); return false;"><img alt="Japanese" border="0" align="absbottom" title="Japanese" height="24" src="http://2.bp.blogspot.com/-O932f9wBvk4/T5xNO_hx5uI/AAAAAAAAAQo/n8-iF7S_R8A/s1600/Japan.png" style="cursor: pointer;margin-right:8px" width="24"/></a>
<a class="google_translate" href="#" target="_blank" rel="nofollow" title="Korean" onclick="window.open('http://translate.google.com/translate?u='+encodeURIComponent(location.href)+'&langpair=auto%7cko&hl=en'); return false;"><img alt="Korean" border="0" align="absbottom" title="Korean" height="24" src="http://3.bp.blogspot.com/-es7IkxUUK_4/T5xNGn7TXYI/AAAAAAAAAQg/jAp6OM-Zj9Q/s1600/South+Korea.png" style="cursor: pointer;margin-right:8px" width="24"/></a>
<a class="google_translate" href="#" target="_blank" rel="nofollow" title="Arabic" onclick="window.open('http://translate.google.com/translate?u='+encodeURIComponent(location.href)+'&langpair=auto%7car&hl=en'); return false;"><img alt="Arabic" border="0" align="absbottom" title="Arabic" height="24" src="http://3.bp.blogspot.com/-cx9e66I48yM/T5xM9L7uzoI/AAAAAAAAAQY/ftpOVX9YZEE/s1600/Saudi+Arabia.png" style="cursor: pointer;margin-right:8px" width="24"/></a>
<a class="google_translate" href="#" target="_blank" rel="nofollow" title="Chinese Simplified" onclick="window.open('http://translate.google.com/translate?u='+encodeURIComponent(location.href)+'&langpair=auto%7czh-cn&hl=en'); return false;"><img alt="Chinese Simplified" border="0" align="absbottom" title="Chinese Simplified" height="24" src="http://1.bp.blogspot.com/-eXup49w042c/T5xMxliSlmI/AAAAAAAAAQQ/v9efq8I4TI0/s1600/China.png" style="cursor: pointer;margin-right:8px" width="24"/></a>
<p><a href="#" id="example-hide" class="hideLink"
onclick="showHide('example');return false;">Hide / </a><a href="http://helplogger.blogspot.com"><font size="1px">Get this widget</font></a></p>
</div>
</div>
Step 4. Now click on Save


