Jumat, 30 Maret 2012

Flash is dead, but....

Flash is kind of dead.  Adobe just pretty much killed it.  But, we have the software and I think it will be an excellent way to introduce you to animation.  We will explore several tools.


Save your Flash documents in the WDrive (make a Flash folder).  Save them in two formats.  First save the Flash document as an .fla file.  Then save the Flash Movie as a .swf file.  Then you will have two files for each project.  You can edit the .fla file.  You watch the .swf file.
Flash is probably new to most of you.  GO SLOW.  Skipping a step will cause your project to crash.  Coding is about being patient, paying attention to details, and seeing the big picture.


Please complete the following tutorials at a minimum on Monday:
Students who have those completed should work on:
If you get excited please start more tutorials (see link on right).

Kamis, 29 Maret 2012

Measuring app engagement across device & platforms

There are more ways now to consume your favorite television shows, movies, and on demand content than ever before. People are turning to their smartphones, tablets, and Internet connected TV’s to watch what they want, when they want it. For broadcasters, agencies, and advertisers the question is how are users engaging with this media and how can it be monetized?

This measurement opportunity is what drove TV App Agency to be founded in 2011. The London-based software company designed a software application that works across a variety of viewing devices to help deliver on-demand media. They turned to Google Analytics as the platform to help them measure and analyze their data.

Why turn to Google Analytics?
TV App Agency opted to use Google Analytics’ server side APIs, which were more easily compatible with the on-demand media environment than JavaScript APIs. They were able to use their own in-house knowledge from previous mobile development to come up with a tagging strategy that highlighted exactly the data that mattered most to their business model. Learn more by reading the full case study.


“We are now able to track which adverts are being played and get an idea of which functions in apps are being used. Plus, the real-time reports show when people are actually using these apps.”
                          Bruno Pereira, co-founder of TV App Agency


Future Analytics goals
TV App Agency is working on expanding their Analytics to track more events, and understand more about viewer engagement from Analytics robust reports. By integrating Google Analytics they are able to offer richer data and analysis than other connected TV app developers, which gives them an incredible advantage in this exciting new space.

- The Google Analytics team

Rabu, 28 Maret 2012

How To Add Related Posts Widget To Blogger with Thumbnails

Now here is a wonderful hack for displaying related posts beneath each of your blog posts, along with thumbnails. The related articles are chosen from other posts in that same category/label/tag. With this hack many of your readers will remain on your site for longer periods of time when they see related posts of interest.
related post, related posts blogger, blogger widgets

Steps adding the Related Posts Widget to Blogger/Blogspot

Step 1. Go To Blogger Dashboard >> Template >>Edit HTML;

Step 2. Check the "Expand widgets template" box;

Step 3. Search (CTRL + F) for this piece of code:

</head>

Step 4. Copy and paste the below code just before/above </head>


<!--Related Posts with thumbnails Scripts and Styles Start-->
<!-- remove --><b:if cond='data:blog.pageType == &quot;item&quot;'>
<style type='text/css'>
#related-posts {
float:center;
text-transform:none;
height:100%;
min-height:100%;
padding-top:5px;
padding-left:5px;
}

#related-posts h2{
font-size: 18px;
letter-spacing: 2px;
font-weight: bold;
text-transform: none;
color: #5D5D5D;
font-family: Arial Narrow;
margin-bottom: 0.75em;
margin-top: 0em;
padding-top: 0em;
}
#related-posts a{
border-right: 1px dotted #DDDDDD;
color:#5D5D5D;
}
#related-posts a:hover{
color:black;
background-color:#EDEDEF;
}
</style>
<script type='text/javascript'>
var defaultnoimage=&quot;http://3.bp.blogspot.com/-PpjfsStySz0/UF91FE7rxfI/AAAAAAAACl8/092MmUHSFQ0/s1600/no_image.jpg&quot;;
var maxresults=5;
var splittercolor=&quot;#DDDDDD&quot;;
var relatedpoststitle=&quot;Related Posts&quot;;
</script>
<script src='http://helplogger.googlecode.com/svn/trunk/related-posts-with-big-thumbnails.js' type='text/javascript'/>
<!-- remove --></b:if>
<!--Related Posts with thumbnails Scripts and Styles End-->

Note:
- to change the default picture, replace the URL in blue with your own
- for displaying more than 5 posts, replace 5 value from "var maxresults=5;"
- remove the code in violet if you want the related posts to be displayed in homepage too

Step 5. Now find the following code:

    <div class='post-footer'>

Step 6. And just above it, copy and paste the below code:

<!-- Related Posts with Thumbnails Code Start-->
<!-- remove --><b:if cond='data:blog.pageType == &quot;item&quot;'>
<div id='related-posts'>
<b:loop values='data:post.labels' var='label'>
<b:if cond='data:label.isLast != &quot;true&quot;'>
</b:if>
<script expr:src='&quot;/feeds/posts/default/-/&quot; + data:label.name + &quot;?alt=json-in-script&amp;callback=related_results_labels_thumbs&amp;max-results=6&quot;' type='text/javascript'/></b:loop>
<script type='text/javascript'>
removeRelatedDuplicates_thumbs();
printRelatedLabels_thumbs(&quot;<data:post.url/>&quot;);
</script>
</div><div style='clear:both'/>
<!-- remove --></b:if>
<b:if cond='data:blog.url == data:blog.homepageUrl'><b:if cond='data:post.isFirstPost'>
<a href='http://helplogger.blogspot.com'><img alt='Blogger Tricks' src='http://3.bp.blogspot.com/-K65p5zLLKQk/T3ObCINoP7I/AAAAAAAABmI/dF84-alnOu4/s1600/best+blogger+tips.png'/></a>
</b:if></b:if>
<!-- Related Posts with Thumbnails Code End-->

Note:
- change the 6 value from max-results=with the number of posts you want to be displayed.
- If you want the related posts to be displayed on homepage too, remove the code in violet.

Step 7. Save the Template

Enjoy :)

Credit goes to: bloggerpluggins.org . Modified by me

Sharing Personalized Dashboards using the Analytics API

Web agencies often rely on Excel and Word to create analytics reports for clients. It’s a manual process that involves a lot of copy and pasting. Yet an agency’s main value-add isn’t report creation, but analyzing data and providing key findings and recommendations to clients. And while Google Analytics provides the tools to slice and dice the data, many web agencies also want to present clients with personalized reports, complete with the agency’s logo. And they want to be able to deliver and share reports without requiring users to log in, especially in large organizations where report distribution can become an onerous administrative process.

DashThis addresses these challenges with dashboards that combine simple automatic reporting with accessibility. Agencies spend less time creating reports and more time analyzing. Using the Google Analytics API, DashThis imports the client’s data and updates a set of dashboards with Key Performance Indicators (KPIs) for a specific job function or industry. The agency can also request a set of custom dashboards that meet exact specifications and requirements.

Alerts and warnings can be set to notify managers of changes in KPIs via email. All this is accomplished securely and without requiring the user to log in. There is also a white-label option for additional branding requirements demanded by agencies.


According to Kari Harju, CEO of SalesLion, an SEO and conversion agency in Helsinki, Finland. “Customers do not always understand how to read the results from web analytics products and see a tangible return on their investments. It's hard to show them without time consuming meetings. SalesLion opted for a custom dashboard to meet the needs of their clients. As a result of using DashThis, our clients now have a simple and easy way to understand what’s going on with their web properties as it relates to their KPIs”. SalesLion eliminated most of the reporting work, leaving more time to analyze, highlight key findings, and make actionable recommendations to clients.


DashThis was built by Trimali Technologies and uses the Google Analytics API. Stéphane Guérin, CEO describes DashThis’ experience with the Google Analytics API and the response from customers, “The API is really simple to use but extremely powerful. It allows developers to add even more value on a great tool such as Google Analytics. We’ve been able to develop strong business relationships with agencies and we’re proud to have made a tool that is useful for professionals. By opening the platform, Google Analytics allows smaller companies like ours to flourish in a rich eco-system.”


DashThis can be found in the Google Analytics App Gallery and on the DashThis website.
If you’re interested in developing solutions for the Google Analytics platform, visit Google Analytics Developers.


Posted by Pete Frisella, Google Analytics API Team

How to change Blogger "Post A Comment" Message

In this tutorial i will show you how to replace the 'Post A Comment' text that appears above the comment form with an image. Also, I will make available to you a few cool images or you can add your own image if you like... so let's get started.


How to replace Post a Comment with an image

To replace  "Post A Comment" message in your Blogger / Blogspot blog follow the next steps:

Step 1. Log in to Blogger, go to your Blogger Dashboard >> Design >> Edit HTML

Step 2. Tick the "Expand Widget Templates" checkbox.

Step 3. Now search (CTRL + F) for the code marked in red:

<a expr:href='data:post.addCommentUrl' expr:onclick='data:post.addCommentOnclick'>
<data:postCommentMsg/></a>


...and for this one too:

<h4 id='comment-post-message'><data:postCommentMsg/></h4>

Step 4. Replace <data:postCommentMsg/> with one of the below images codes:


<img src="http://1.bp.blogspot.com/-DuwsWbCqRag/T3Mxtrye2zI/AAAAAAAABkA/AqMIP-ybAWQ/s1600/leave+a+comment.png" />


<img src="http://2.bp.blogspot.com/-gQV9PoM4FeA/T3M1tOg6C3I/AAAAAAAABkI/OTq4DAbkEPo/s1600/Post+a+comment+blogger.png" />


<img src="http://4.bp.blogspot.com/-wX61ZaQ1piI/T3M3FKUaGhI/AAAAAAAABkQ/y409edvuAQA/s1600/animated+comment+arrow.gif" />


<img src="http://1.bp.blogspot.com/-bIOcD7FxKXw/T3M4LpQ0XFI/AAAAAAAABkg/z_sHmmnKwgs/s1600/leave+a+comment2.png" />


<img src="http://4.bp.blogspot.com/-0j9qVbZuAtc/T3M6HP2tT6I/AAAAAAAABkw/imDcGGmxOiU/s1600/comment.gif" />

You can use your own image instead. Just upload your image on Blogger, switch to Edit HTML tab, copy the image code and replace <data:postCommentMsg/> with your code.

UPDATE! Step 5. The first steps will replace the text only when there are no comments available. To show the image each time new comments are added, we should add the code of the image we want to appear after the 4th of the below code (search 4 times for it):

<p><data:blogCommentMessage/></p>

Step 6. Save Your Template.


Thats it! I hope you like your new comment form !

Selasa, 27 Maret 2012

TED Talks and Writing Effectively

I am on a field trip to WCSU today to rehearse iAlchemy.  I am eager to see what you write about these subjects.  There is plenty to write about! This is your first grade of the fourth marking period.  Write well!

Today's objective is to write three blog posts about these TED talks.  I would like to see that you can:
You must write about THREE of the videos.  This should take you just about exactly 85 minutes.

1. Keith Barry.  This will blow your mind.  How is brain magic different than regular magic?


2. David Blaine.  Is he crazy, or determined?


3. Robert Lang and his origami.  Why has origami changed?


4. Bryan Stevenson and injustice.  Reflect on the connection between this talk and the Trayvon Martin case.


And a few extras if you have time:

Rives 1, Rives 2  This guy is a great storyteller.

If anything does not work or is blocked please use google to search for the video.  Make it happen.


Senin, 26 Maret 2012

Think with Google comes to ad:tech SF to make the web work for you

More users. More screens. More content. Same time. Same customers. Same goals.


As marketers, it’s a challenge to stay up-to-date on the latest digital media innovations while continuing to manage effective, measurable campaigns. We at Google asked ourselves: how can we help you meet these challenges and move your customers from intent to action? How can we make the web work for you?

Next week at ad:tech SF we’ll answer these questions through a 4-part “Think with Google” series.

Tuesday, April 3rd
  • Come hear from John Nicoletti, Director of Agency Development, on winning the moments that matter, making better decisions and operating more efficiently as you grow.
  • Dive deep with Bill Kee, Analytics Product Manager, on ways to approach marketing attribution and what Google Analytics is doing to make attribution modeling more accessible.
  • Learn about free tools available to help you plan for performance with Jordan Rost, Agency Lead.
  • Close the day with Rikard Steiber, Global Marketing Director, Mobile & Social Advertising, on how to use Google+ Pages to maximize your business’ effectiveness and presence online.

Wednesday, April 4th
Global Google Analytics Lead Rachel Witalec will join the discussion on search tactics for making sure content gets found where and when you want it. If you’re investing time in digital marketing you won’t want to miss this.

The complete conference agenda is here. The sessions are open to ad:tech attendees.

Still haven’t registered? Sign up here with discount code GOOGLESF12TB and save 30% off a full conference pass.

Hope to see you there!

Catch-Up

I will be catching up on grades today as I close grades for 1st marking period.  I will pass out grade sheets.

If you notice errors, let me know.  If you notice anything missing please submit to "MISSING WORK" folder in the UDrive-WebSchneider.

Many of you have lots of missing work.

Minggu, 25 Maret 2012

How to optimize Images and Increase Blog Traffic

This tutorial will explain you how to optimize images before uploading them to internet. Generally most of people don't optimize images before uploading it to Blogger as needed. Optimizing images should be done when talk about the SEO (Search Engine Optimization). Learning the correct and proper way of optimizing images in blogger is important. Google Image search is used widely for finding quality reference images, icons and photos. A great percentage of our blog traffic depends on Image search. When we are downloading images, most of the time they are saved with very odd names and we don't take any interest in modifying the name. So you should always consider two things when uploading images to Internet these are proper use of alt tag and image name should be change with proper keyword. Let me explain..

1. Change Image Name with Keyword
see in the screenshot
When we are downloading images from Internet, generally they are saved in local drive with some very odd name like untitled.jpeg, img1.jpeg etc. So changing these names with appropriate keywords is always helpful. For example, if i want to add img1 or untitled in this post then definitely i will change these name with those words which describe the content called keywords so i will change to image SEO.jpeg or optimize image.jpeg.


2. Use alt attribute

Search robots can not read multimedia may it be graphic images or flash. An image is meaningless for search spiders if it is not defined(tagged). So to tell search robots what the image is all about, we can add an alt tag to our image code. When you add a photo to your post editor, switch to "Edit HTML" mode and find the HTML code for the image which will look something like this:

<div class="separator" style="clear: both; text-align: center;">
<a href="http://3.bp.blogspot.com/-0pPwY8vht0E/T2-dBct3GkI/AAAAAAAABis/jXslqh3r_bw/s1600/how+to+seo+optimize+blogger+posts+titles.jpg" imageanchor="1" style="clear: left; float: left; margin-bottom: 1em; margin-right: 1em;"><img border="0" height="104" src="http://3.bp.blogspot.com/-0pPwY8vht0E/T2-dBct3GkI/AAAAAAAABis/jXslqh3r_bw/s200/how+to+seo+optimize+blogger+posts+titles.jpg" width="100" /></a></div>

Now you need to identify the HTML code of the image which is marked with red. Just add the underlined alt tag after <img as shown below:

<div class="separator" style="clear: both; text-align: center;">
<a href="http://3.bp.blogspot.com/-0pPwY8vht0E/T2-dBct3GkI/AAAAAAAABis/jXslqh3r_bw/s1600/how+to+seo+optimize+blogger+posts+titles.jpg" imageanchor="1" style="clear: left; float: left; margin-bottom: 1em; margin-right: 1em;"><img alt="image description" border="0" height="104" src="http://3.bp.blogspot.com/-0pPwY8vht0E/T2-dBct3GkI/AAAAAAAABis/jXslqh3r_bw/s200/how+to+seo+optimize+blogger+posts+titles.jpg" width="100" /></a></div>

Replace image description with your own keywords. And try to write short sentences to describe them, also keep description limited to 4-5 words. Less is better.

How To SEO Optimize Your Blogger Blog Titles For Higher Search Results

This is called "Blogger/blogspot Title Swapping". Swapping blogs title can help boost your position in search engine results page listing and also increase clickthroughs. From an SEO (Search Engine Optimization) perspective, page title is the most important element in your blog in terms of ranking well in search engines. If you look at your browser's title bar you will notice that Blogger's default templates display your blog title in front of each page or post title. So page title would normally be displayed as:

search results, blogger seo, seo

After swapping the blog title, it will be appearing like this:

seo optimization, title swapping, blogger optimize
This kind of placement will be also appearing in google search results. The reason why you should put post titles at the beginning is because users are more likely to search for specific post content rather than the actual name of your blog. So having the post titles at the beginning increases your chances of being found.

How to optimize blogger post titles

Step 1. Log in to your Blogger Dashboard and go to Template > Edit HTML


Step 2. Check the "Expand Widget Templates" checkbox


Step 3. Find (CTRL + F) this code:

<title><data:blog.pageTitle/></title>


Step 4. Replace the code above with this one:

<b:if cond='data:blog.pageType == "item"'>
<title><data:blog.pageName/> |<data:blog.title/></title>
<b:else/>
<title><data:blog.pageTitle/></title> </b:if>

Step 5. Click Save Template and you are done.

Jumat, 23 Maret 2012

Measure your website’s performance with improved Site Speed reports

In our continued effort to improve your experience of Google Analytics, we are excited to release an updated Site Speed report that distills all the key metrics into a quick & easy to read Overview report.

Site Speed Overview Report
The Overview report provides an at-a-glance view of essential information for measuring your site’s page loading metrics: Avg. Page Load Time by Browser, Country/Territory, and Page. Plus you can compare your site’s average performance over time to forecast trends and view historical performance. All of these tools can help you identify where your pages may be underperforming and adjust so more visitors land on your site instead of waiting in frustration or leaving.
Example of updated reports   

Previously there was only one Site Speed report, this has been renamed to “Page Timings”. On the Page Timings report, you can view your site's load times in three ways: use the Explorer tab to explore average load time across dimensions, use the Performance tab to see how the load times break down by speed ranges, or use the Map Overlay tab to see how the load times breakdown by geography.

Previous report, now Page Timings   

Speed metrics available in Intelligence Reports & API
The technical metrics included in the Page Timings report were launched a couple of months ago. So we’ve been working hard at making these metrics available in more of your favorite Analytics features. We’ve updated the Intelligence Reports to include the average site load times and all the Page Timings metrics. Now you can create custom alerts based on site speed metrics such as Avg. Page Load Time, Avg. Server Response Time. And view site speed metrics in the Analytics API and Custom Reports.

Site Speed Sample Rate
Small sites (<10K visits per day) can now increase the site speed sample rate up to 100% to get full samples for page load time. Note that the processing limit of up to 10K per day or 1% of pageview hits (whichever is greater) still applies.

- Mustafa M. Tikir, Google Analytics team

Kamis, 22 Maret 2012

How To Remove Blogger Attribution Gadget

The Attribution gadget is the gadget in the footer that says "Powered By Blogger". If you have tried to remove this then you may of noticed this gadget is locked into you blog. To unlock it, follow the next steps:
blogger attribution, blogger hacks, powered by

Step 1. Log in to your Dashboard, go to Template > Edit HTML

blogger tricks, blogger hacks,

Step 2. Check the "Expand Widget Templates" box


Step 3. Search (CTRL+ F) for this code:

<b:widget id='Attribution1' locked='true' title='' type='Attribution'>

Step 4. Replace true with false

Step 5. Click on the Save Template button

Now attribution gadget is unlocked and it can be removed. Just go to:

  • Layout and click on the edit link from Attribution gadget:
  • Click on the Remove button - as you can see in the screenshot below:
That was all !

How to add a gadget/widget inside your Blogger Blog header

Maybe you have seen that many blogs have AdSense Units or other ads and widgets in the header section of the blog, the most popular format being the AdSense 468x60 ad unit - see in the screenshot below:

But how we can add something inside blogger header - be it a Adsense unit, a search bar, social media buttons or a widget? By simply adding a section in the header. First off, to give space for the extra gadget to fit in, our blogger header should be resized.

A. Resize blogger header

Step 1: Go to Blogger Dashboard > Template > Edit HTML and backup your template

Step 2: Click anywhere inside the code area and open the search box by using the CTRL + F keys:
adsense, blogger tricks, blogger widgets

Step 3: Search for this piece of code:
/* Header
----------------------------------------------- */
Note: If you can't find it, search only for the first line:
/* Header

Screenshot:
blogger gadgets, blogger widgets, blogspot tricks

Step 4: Replace it with this code:
/* Header
----------------------------------------------- */
.header-left{
display: inline-block;
height: 35px;
width: 350px;
float: left;
}
.header-right {
display:inline-block;
float:right;
}

Change the pixels in red with the image's height and width of your blogger header and change float: left; to float: right; if you want to change the position of your logo.

Step 5: Find the below code:
<b:section class='header' id='header' maxwidgets='1' showaddelement='no'>

Step 6: Replace it with:
<b:section class='header header-left' id='header' maxwidgets='1' showaddelement='no'>

Now "Preview" your template, you will find that the background color of Blogger's header is not visible or it's missing. To bring it back, you need to add some more snippets:

Step 7. Find the following code:
    </div>
    </div>
    <div class='header-cap-bottom cap-bottom'>
      <div class='cap-left'/>

Step 8. Just above it, paste this:
<div style='clear:both;'/>

Note: if you can't find the code from step 7, search for this instead:
      <b:include name='description'/>
    </div>
  </b:if>
</b:includable>
</b:widget>
</b:section>
... and paste the code from step 8 just below it.

B. Add extra gadget/widget section to Blogger Header

Let's go one step forward and add an extra gadget section within Blogger header in new template designers.

Step 9. Just below the code from step 8, paste this codejust before/above it:
<b:section class='header-right crosscol' id='header-right' maxwidgets='1' showaddelement='yes'/>

Step 10. Now find:
]]></b:skin>

Step 11. Paste just above it, this CSS code:
.header-right {
display:inline-block;
float:right;
width:400px;
}

Change the width that is marked in red color. Increase or decrease the pixels according to your needs and positioning new header section.

Step 12. Save the Template.

Step 13. Now all you have to do is to go to Layout and Add a Gadget to the newly created extra header section in Blogger.

widgets for blogger, blogger tricks

The widget now should appear side by side.

If you have any questions or need some help, leave a comment below. 

Better Insights with Flow Visualization Enhancements

We've been listening to your feedback about Flow Visualization, and we’re excited to announce a number of significant upgrades that are available to all our users starting today.

Events Flow
We’ve expanded the Flow Visualization family of reports to now include Events Flow! This new feature can be found in the Content->Events section:

What problem does Events Flow help solve?
Event-driven websites had a difficult time analyzing the impact from their visitors using flow visualization. These are websites that land users on one URL, where there are multiple elements on that page for a user to interact with  (such as videos, roll over buttons, or games). These sites tend to have very few pages and get most of their value from visitor interactions with events. The Events Flow report addresses this issue by showing the order of events in which your visitors engaged.


For those who have used Visitors Flow before, the feel of the Events Flow report will be familiar - it includes all the same interactions of hovering, clicking, and adding additional steps. You can also analyze the flow of events by grouping the nodes in any of the following 3 options: Category, Category/Action, or Category/Action/Label.  For more information about using the Events Flow report, view our help center or this how to video to see how we analyzed the events that occurred in our very own Flow Visualization reports!

Flow Visualization Date Comparison
You can now compare two date ranges for the entire family of Flow Visualization reports: Visitors Flow, Goal Flow, and even the new Events Flow. This feature will help you to gain insights on how your visitor engagement changes over different periods of time.

Example of Goal Flow Date Comparison

Now you can analyze and measure how changes to your pages and/or goal steps affect your visitors behavior. It optimizes your workflow by removing the need to perform manual calculations and open two browsers to view two flow visualizations side-by-side. You can now do them all in one screen.

Plus, you can also highlight connections and instantly update all the comparison numbers for that particular traffic. Below is a real-life example from our Google Store. We compared two time periods (where we have removed a particular goal step) and discovered that pageviews from Firefox went down 15%.

From an initial impression, one might have concluded that the removal of the goal step could have potentially lower the traffic. However by highlighting that flow we were able to isolate that traffic to see how many orders were successfully completed. That was how we learned the number of orders actually went up 67%, and the removal of the goal step helped increased our conversion rates!

This feature can be extremely powerful for gaining additional insights on how to optimize conversions and the website experience for your visitors. Learn more in our help center.

Additional Goal Types in Goal Flow 
Are you interested in seeing how users convert on non-URL goals? Now you can, we’ve added support for additional types of goals including time on site and engagement in the Goal Flow report. Head on over to the Goal Flow report to choose the goal(s) you’re interested in.

Here are links that will help you easily find these reports in your Google Analytics account.
We hope these enhancements make Flow Visualization even more comprehensive and allow you to gain deeper insights. Please reach out to us with questions and comments, and we are always happy to take additional feature requests.

- Jerry Hong, Google Analytics team

Good job

halloweensnow I was about to give Caitlin a zero for manipulating her Fireworks image. I thought "she just took a picture and didn't change it". Then I read her blog. Cool.

Check out some of our images (I'll add more).

Rabu, 21 Maret 2012

HTML and Fireworks Exam


Snowtober
Here is your marking period exam.  This is worth 20% of your grade and is due by the end of class.

Please prepare an HTML website using notepad about the October Snowfall.  I am looking to see that you can use your new Fireworks talents to enhance your website.  The site should include:
1. Create a website using HTML that demonstrates the following:
  • That you can use proper HTML codes.  
  • You can create links that work, are effective, and efficient.
  • You demonstrate attention to those with vision issues by including alt text for all images.
  • A modern, usable design.
2. You must include a table or other device that shows how this snowfall ranks all-time. Cite where you obtain your data.
3. You must include an image or animation that has been manipulated using Fireworks. This image must be obtained using Creative Commons (Flickr,wikicommons, etc...). You may create the image yourself if you choose.  Save the link, you'll need it later.
4. A summary paragraph.  You must include at least one link to valuable information about the storm.
5. Your audience is 5th graders in Seymour.
6. Your website must be free of bias and be highly usable.


How to save your project:
1. Rename your folder in the WDrive. Name it first initial-last name-test (bschneidertest).
2. Copy folder.
3. Find class folder in UDrive. (Udrive-WebSchneider-Class-TEST)
4. Paste folder into UDrive.
5. HAVE NEIGHBOUR TEST WORK TO MAKE SURE EVERYTHING WORKS!! Format the links correctly! Remember, just use the file name (don't add w;drive in code....).

6. Saving correctly is one of our standards.  I will not grade your test if I can't find it!


Blog Post:
1. Where did you get the image?  Include link.  If you created it yourself then please state that.
2. What aspects of coding or image manipulation have you gotten better at?
3. How did you manipulate your image in Fireworks?
4. What do you need to improve on?

Website 80%, Blog Reflection 20%

Rubric


You have two things due.  Test and Blog post about test.  The bell is your deadline.  Do GREAT work.

Selasa, 20 Maret 2012

Capturing The Value Of Social Media Using Google Analytics

Measuring the value of social media has been a challenge for marketers. And with good reason: it’s hard to understand exactly what is happening in an environment where activity occurs both on and off your website. Since social media is often an upper funnel player in a shopper’s journey, it's not always easy to determine which social channels actually drive value for your business and which tactics are most effective.

But as the social industry matures, marketers and web analysts need true outcome-oriented reports. After all, although social is growing in popularity, brand websites - not social networks - remain the place where people most often purchase or convert. 

That’s why we’re releasing a new set of Social reports within Google Analytics. The new reports bridge the gap between social media and the business metrics you care about - allowing you to better measure the full value of the social channel for your business. We wanted to help you with 3 things:
  • Identify the full value of traffic coming from social sites and measure how they lead to direct conversions or assist in future conversions 
  • Understand social activities happening both on and off of your site to help you optimize user engagement and increase social key performance indicators (KPIs)
  • Make better, more efficient data-driven decisions in your social media marketing programs

The Social reports allow you to analyze all of this information together and see a more complete picture of social impact than often used today. Here are a couple of the things you can do with our new reports:

Overview Report: see social performance at a glance and its impact on conversions


The Overview report allows you to see at a glance how much conversion value is generated from your social channels. The Social Value visualization compares the number and monetary value of all your goal completions against those that resulted from social referrals - both as last interaction, and assisted.

A visit from a social referral may result in conversion immediately or it may assist in a conversion that occurs later on. Referrals that lead to conversions immediately are labeled as Last Interaction Social Conversion. If a referral from a social source doesn’t immediately generate a conversion, but the visitor returns later and converts, the referral is included as an Assisted Social Conversion. 

Conversions Report: which goals are being impacted by social media


With the Conversions report, marketers can now measure the value of each individual social channel by seeing the conversion rates of each social network and the monetary value they drive to your business.

For example, you can see the effect that social content (i.e. a new video you created) had on conversions. Look at the time graph to see whether Goal Completions via Social Referral peaked after the content was published. Remember that you need to define goals and goal values in order to see data in this report, so tailor it to the things that matter to your business. Networks with a higher assisted / last interaction conversions ratio provide greater assisted conversions.

Social Sources - find out how visitors from different sources behave


The Social Sources report shows engagement and conversion metrics for each social network so you can see how people are interacting with your content and whether it’s leading to a desired outcome.

For example, if you run social campaigns that promote specific products, you can see via the Social Visitor Flow whether visitors from each social network entered your site through these product pages and whether they continued on to other parts of the site or whether they exited.  

Social Plugins: find the content that’s good enough to share


If you publish content, you'll want to know which articles are most commonly shared or recommended, and on which social networks they're being shared. The Social Plugin report shows which articles on your site are receiving the most engagement and which social buttons - for example, Google +1 - are being clicked to share them. 

You can use this information to create more of the type of content that's popular with your visitors, and test different layouts of social sharing buttons to improve use by your community. 

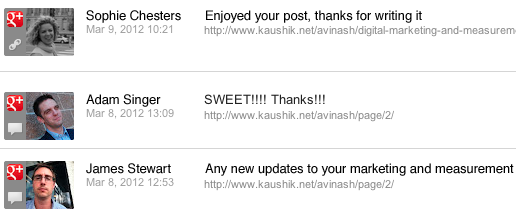
Activity Stream: what’s happening outside of your website

While the other reports show you the impact that social engagement is having on your site, the Activities Stream tab (located within the sources report) shows how people are engaging socially with your content off your site across the social web. 

For content that was shared publicly, you can see the URLs they shared, how and where they shared (via a “reshare” on Google+ for example), and what they said. Currently, activities are reported for Google+ and across a growing list of our Social Data Hub partners including recently signed brands Badoo, Disqus, Echo, Hatena and Meetup.

These new social reports will be available for all users over the next few weeks under the Standard Reporting Tab - please take a look and tell us what you think.

Posted by Phil Mui, Group Product Manager

Senin, 19 Maret 2012

How to Burn Blogger RSS Feeds at Feedburner

What is RSS?

A RSS (Really Simple Syndication) feed is a XML-based format for your content. Most blogging platforms, for example, will have an RSS feed built in. Whenever you start publishing posts, your latest posts will be updated in the RSS feed. Visitors to your website can subscribe to your blog’s RSS feed in an RSS reader such as Google Reader.

What is FeedBurner?
Most blogs have RSS feed which is detected automatically by commonly used feed readers when the blog URL is added to the reader.

However, if you want to make it more obvious and easier for readers to subscribe using RSS, or want to know exactly how many people subscribe to your blog then the best option is to add a Feedburner RSS feed and email subscription to your blog.

Feedburner is a free web service which enhances bloggers and podcasters ability to manage their RSS feeds and track usage of their subscribers.


How to create a feed with feedburner

1. Go to Feedburner and sign in to Feedburner with your Google Account (create a Google Account first if you don’t have one).

2. To set up your RSS feed with Feedburner, simply copy the URL of your RSS feed and paste it into the “Burn a feed right this instant” box. Then click Next >>


3. On the next screen, choose the second options - RSS.


4. On the next screen you will be given your RSS feed’s new URL on Feedburner. You will want to use this URL anywhere you reference your RSS feed on your blog. Change the feed title and address with your own.


5. When you click on Next, you will be given the options to setup tracking features for your RSS feed.
Check "Clickthroughs" and "I want more!..." options.


Adding Your Feedburner Feed To Your Blog

This is used to add the RSS icon and easy subscribe options to your blog side bar using a text widget as explained below:

1. Click on the Publicize Tab > Chicklet Chooser in your Feedburner account and copy the HTML code.

2. Go to Blogger Dashboard > Design > Page Elements and add a new gadget

3. Select HTML/JavaScript from the pop-up window and paste the html code in the box.

Adding a FeedBurner Email Subscription

After you have set up your feed, you will want to consider giving visitors the option to subscribe to your content via email. If so, you will want to go to the Publicize tab and click on Email Subscriptions. Click on the Activate button to start email subscription service for your RSS feed.


You will then want to click on Communication Preferences in the left sidebar menu. This will allow you to customize the activation email subscribers receive to confirm their subscription.


Once customized, click Save. The next options you will want to configure are under Email Branding in the left sidebar menu. This is where you can upload a logo, customize the Email Subject line, and change the font styles, colors, and sizes to format the email subscribers will receive. Click Save when finished.

The last (and most important) setting for your email subscription is the Delivery Options. This is where you will tell Feedburner what time to deliver new RSS feed updates to subscribers.

Once saved, click on the Subscription Management link. Here, you can get the code to add a subscription form on your blog or you can get a link to your take visitors to the opt-in form for subscribing via email.

To add it on your blog:

1. Go to Blogger Dashboard > Design > Page Elements

2. Add a new Gadget

3. Select HTML/JavaScript & paste the code in the box.

Redirecting All Your Blog Feed To Feedburner

Unless you redirect all your blog feed to Feedburner you won’t get accurate subscriber numbers because some of your readers subscribe using your original blog feed.

To do this:

1. Go to Settings > Site Feed in your blog dashboard

2. Add your Feedburner address to Post Feed Redirect URL and click Save Changes.


3. Now all your feeds is automatically redirected through FeedBurner and you’ll be able to track subscribers.

If you are enjoying reading this blog, please consider Subscribing!