Rabu, 25 November 2009

Episode # 3 - Rapid Fire Web Analytics Q and A with Avinash and Nick

This is the third video in our recent Rapid Fire series where you share your most burning questions via the Google Analytics Google Moderator site and we answer them!

Generally we want to focus on your questions about key metrics and analysis techniques, but this week we get a little technical.

In this episode we discuss:
  • How to group referrals from common sources
  • How to setup Google Analytics to track multiple web sites and view all the aggregate data in one profile
  • Strategies to track websites that support different languages
  • The value of using Google Analytics on You Tube partner channels
  • Troubleshooting discrepancies in Google Analytics Data
  • Best practices for implementing E-commerce tracking for E-commerce sites
  • Simplifying customizing the date range in GA
  • How to track segments of users who interact with internal referrals/cross sell campaigns
  • Tracking Social Media campaigns


Here are links to resources we discussed in the video:
If you found this helpful, we'd love to hear your comments.

If you have a question you would like us to answer, please submit a question or vote for your favorite question in our public Google Moderator site. Avinash and I will answer your latest questions in a couple of weeks with yet another entertaining video.

Please add your thoughts about the Q&A via comments below. Thanks!

Kamis, 19 November 2009

Depth and Discovery: Powering Visualizations with the Google Analytics API

We're always really excited to see what developers are building with Google Analytics. Here's an amazing visualization using the API from our friends at Juice Analytics. Now, this is what we're talking about when we say this stuff is "Off the charts!" (The API team t-shirt slogan). :-)

At Juice, we work with web analytics APIs large and small, from Google, comScore and Omniture. The Google Analytics API is our favorite. It powers the world's best, most widely deployed analytics site. And it powers Juice products like Concentrate (innovative search analytics) and Vasco de Gapi (a tool for exploring the Google Analytics API).

We were approached by the Google Analytics API team to explore new ways of looking at data with the API, and we were excited by the possibilities. We've been working on our own visualization framework, JuiceKit, that integrates the power of the Flare Visualization Library with Adobe Flex.

The result is Analytics Visualizations, two visualizations powered by the Google Analytics API that are free to use. You just need a Google account with access to Google Analytics data to explore your own data. Here are the details about the visualizations, called Referrer Flow and Keyword Tree.

Referrer Flow

Curious about what sites are linking to you and what content is benefitting the most? The Referrer Flow visualization answers those question and shows how results change over time. It's a stream of daily treemaps showing pageviews and bounce rates for various groupings of your website's pages. You can group by combinations of page title, referrer and url.
Here is a brief video introduction:


Clicking on the treemap will filter all the data by the page, referrer or url that you clicked on. Click again to clear your filter.

Keyword Tree

A list of top keywords isn't enough to really understand how people are searching and finding your site. The Keyword Tree visualization displays the most frequently used search keywords and how they are used together. Here's a video overview:


You'll see a frequently used search term at the center and the words and phrases that are most often used in combination with that word. Pick a different starting word by typing into the box in the upper right or selecting from the top word across the bottom of the screen. The words are sized by their frequency of use and colored by bounce rate (or % new visitors or average time on site). Roll over a word to see details about that combination of connected words.

Depth and Discovery

In designing these visualizations we focused on the question: how can we let users uncover the unexpected? That means designing targeted visualizations focused on limited well-defined issues. The Referrer Flow monomaniacally focuses on a single question "What pages are people viewing on your site and where are they coming from?" The Keyword Tree is laser-focused on word ordering and what that means for keyword performance.


The Google Analytics reporting tool is a great general-purpose reporting solution. It gives the advanced users everything they need to answer specific questions. However, its generality means it has limited ability to focus on two issues; depth and discovery.

The Google Analytics API is Google's solution to this problem. It's an opportunity both for businesses like ours that can create new ways of analyzing data, and for large sites that can use the API for integration, custom analytics, and more.


Thanks, Juice! We continue to be impressed by the new solutions developers are bringing to market by leveraging the Google Analytics Platform. If you have developed a useful new tool or integration on top of Google Analytics, drop us an email at analytics-api@google.com. If it's innovative and useful we'll highlight it to our readers on this blog.


Selasa, 17 November 2009

An Integration With Feedburner

The FeedBurner team has just announced an integration with Google Analytics. We know what many of you are saying. "About time!" We'll take it.

If you are using both Google Analytics and FeedBurner, you will automatically see campaign attribution for item clicks tracked by your AdSense For Feeds or your Google FeedBurner account. To read more and get details, please see the blog post here and take a look at the below image:

It works in the same way as URL tagging. You can see how many people click through to your site from the content sent by you in your feeds. FeedBurner is now automatically inserting Google Analytics tracking codes into the URLs of your items, or content. For instance, if you publish a blog and a subscriber reads it and then clicks through to your site, you will see that the source of that visit is Feedburner. And as you can see, it gives even more granular information, such as the type of feed reading software or email.

Taking a step back. What is a feed? From the help article, feeds "are a way for websites large and small to distribute their content well beyond just visitors using browsers. Feeds permit subscription to regular updates, delivered automatically via a web portal, news reader, or in some cases good old email. Feeds also make it possible for site content to be packaged into "widgets," "gadgets," mobile devices, and other bite-sized technologies that make it possible to display blogs, podcasts, and major news/sports/weather/whatever headlines just about anywhere." The most popular types of feed formats are RSS and Atom feeds.

If you're publishing content like this blog, then feeds are probably half the story. Feed subscribers are a very important audience to be aware of. If people are really interested in what you have to say, they'll subscribe to your feed or RSS so they can be automatically updated every time you publish new content. They don't want to miss it, and don't want to have to keep visiting your page to check if you've published new content. FeedBurner is the way you can measure how many people are using your feed and who they are. It's could be called Google Analytics for feeds :-) Or Google Analytics could be called web...analytics...burner?

Anyway, FeedBurner shows you not only how many subscribers your feed has, but also metrics like geography and reach, with a breakdown by each piece of content (or "item") you publish. It also tells whether they clicked on a link in that content or went to the actual piece of content on your site. You can also see where the subscriber is reading your feed; whether in email or some kind of feed reader, such as Google Reader.

Another thing to be aware of is AdSense For Feeds, which allows you to monetize your feeds by placing AdSense ads in them.

This integration is the first step towards using these two very similar tools together. You still need to log in to FeedBurner to actually see how many subscribers you have and the rich detail around your feed usage FeedBurner provides.

Jumat, 13 November 2009

New Feature Spotlight: Analytics Intelligence

How would you like to have 24-hour a day access to a dedicated assistant who is focused exclusively on your site's analytics? Your assistant would be so diligent and detailed that they wouldn't miss a thing. Sound too good to be true? We're giving you one. Say "Hello" to Analytics Intelligence.

Your new hardworking assistant, Analytics Intelligence, can't replace you or a professional analyst. But, it can find key information for you and your professional analysts -- so that your team can focus on making strategic decisions, instead of sifting through an endless sea of data.

Analytics Intelligence constantly monitors your website's traffic. Anytime something significant happens, it adds an automatic alert in your Intelligence reports. If your bounce rate suddenly jumps on one of your referrals, Analytics Intelligence creates an alert. Of course, it's up to you to go find out that the bounce rate jumped because someone inadvertently changed the landing page. But you might not have noticed that there was a problem that needed fixing if your trusty assistant hadn't alerted you.


Behind Analytics Intelligence is a sophisticated algorithmic intelligence engine that detects any anomalies in your traffic patterns. That means it's smart enough to know the difference between a change that's actually part of a larger trend versus a change that you might need to look into. But, from a user perspective, Analytics Intelligence couldn't be simpler.

Navigate to the Intelligence reports and you'll see three reports -- Daily Alerts, Weekly Alerts, Monthly Alerts. Daily Alerts contains all the alerts that are based on daily data. Weekly Alerts contains alerts based on weekly data. Monthly Alerts contains, you guessed it, alerts based on monthly data.

When you look at your alerts, you'll notice that your trusty assistant has already gone through your historical data and posted alerts. This highlights a key feature of Analytics Intelligence: you don't have to do anything -- alerts automatically get posted to your account.

The best way to come up to speed on Analytics Intelligence is to take a look at the alerts that are being created for your data. You can learn everything you need to know about how to interpret your alerts in this 2-minute video.

You can also instruct your assistant to be on the lookout for specific things that you want to monitor. Let's say you are running a billboard campaign in New York's Times Square. You want to be proactively informed regarding how the campaign is impacting traffic from New York. To do this, go the Manage Intelligence Alerts page,


and set up a custom alert (see the example, below).


You might even want to set up a second alert that checks for decreasing New York traffic, so you can see if the campaign is starting to wind down.

You'll then receive a custom alert, posted in your Daily Alerts, whenever one of these things happens. You can be notified by email as well, so you'll know what's going on even if you're not checking your reports.

If you're ever unsure about how to set up an alert, try starting with one of the templates on the Manage Intelligence Alerts page. Just click Copy, and then modify and rename the alert to fit your needs.


As with automatic alerts, the best way to learn about custom alerts is to try them out on your own data. You can also refer to the articles on Analytics Intelligence in the Google Analytics Help Center.

Sign in to your account to try it out. It's time to meet your new assistant!

Rabu, 11 November 2009

New Feature Spotlight: Advanced Filters

Here is another in-depth look at one of our recently announced new features: Advanced Filters (or Advanced Table Filters), written by the excellent team at LunaMetrics, a Google Analytics Authorized Consultant.

For the daily user, Advanced Filters may be the most useful new feature of the bundle of new features, in terms of streamlining your actual process once you access a report and are actively doing analysis. They are found at the bottom of the table in any report. As a habitual poweruser, I've been clamoring for it for years, and it has made my process so much simpler. It's the equivalent of replacing a screwdriver with a powerdrill.

You no longer need to export your data to slice and dice it to see your desired subsets. Now, you can set a filter while looking at a certain report to get the information you want, without having to exit and create a filter or advanced segment. Within seconds, you can whittle down a massive data table to look at a subset that is important to you.

One example already given in this tutorial video is to show just the keywords that have a low bounce rate (less than 30%) and that referred at least 25 visits. Right away, you've found high value and high traffic keywords. We're using this feature almost every time we look at a data table in a report. It makes you feel much more command over your data.


Here are three more interesting uses of the new Advanced Table Filtering:


Looking for specific non-branded keywords

Sometimes, it helps to see keywords that contain a certain word or phrase, but exclude the brand name. Taking a company called DeLallo Italian Foods, for example. If I wanted to see all the keywords that contain the word Italian food but exclude the brand name DeLallo, I could easily use the advanced filters for this. Previously, I would have done this using regular expressions in the filter:

Filter Keyword: containing ^(?=.*italian food)(?!.*(delallo)).*

No more! Now, we don't need to do this! Now, it is so easy with the advanced filters. Just filter for Keyword containing Italian food and excluding DeLallo.

And presto! Your report is updated. And, at any time, you can edit this filter to further refine it, or delete it altogether.


Landing Pages, Sorted by Bounce Rate


Has this ever happened to you - you're looking at your Top Landing Pages report, and you sort by bounce rate, only to have a bunch of pages with 1 entrance clogging the top of the report? With advanced filters, you can filter out those pages with a low number of entrances to get a better look at which landing pages with significant traffic have a high bounce rate. All you have to do is filter by Entrances greater than 50 (or whatever threshhold floats your bounce-rate-boat).


Top Content, Sorted by $ Index


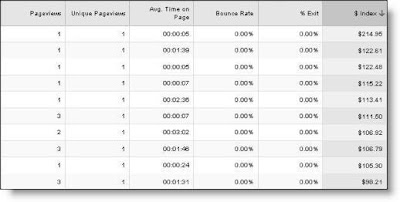
Another similar use for sites with e-commerce or a goal value enabled is when you're looking at the Top Content report, sorted by $ Index. What you're trying to find are the pages that have the highest value - those that are viewed during a visit that results in a conversion. Again, it's common to get a lot of pages at the top that have a low number of pageviews.


First, it helps to filter out those pages that have a low number of pageviews. But once you do that, you'll likely see the pages with the highest $ Index are pages of your shopping cart or checkout process. We can filter out these pages with the advanced filters too - just add a new condition below your first filter that excludes pages that contain the word cart (or checkout, etc.) in the URL.


These three examples give you a taste of Advanced Table Filtering for your analytics, but they just scratch the surface. Once you explore your own analytics, I’m sure you’ll find many more uses of this flexible and powerful new feature. You'll really notice it's use when you find you're happily lingering for 5 extra minutes, using this new interface feature to easily gain insights and ask questions that would've taken you an hour before and possibly a data export. Pure wizardry. :)

Jumat, 06 November 2009

New Free Google Analytics API Dashboard Application

If you manage many Google Analytics profiles, it can be difficult to stay on top of all your top line metrics across accounts -until now. Trakkboard is a free, easy to use desktop application that allows analysts to create dashboards that pull data across different Google Analytics logins and different Google Analytics profiles to display top level metrics all within the same view.


This application was built using the Google Analytics API by our friends in Germany, Trakken GmbH and is available in English, German and Spanish. Once downloaded, you can add multiple Google Accounts, select Google Analytics Accounts and profiles, then choose from any of the pre-canned report widgets. The report widget will then appear on the dashboard. This process can be repeated with other Google Analytics Accounts, Profiles, and Widgets - and your customized dashboard is ready to use.


What's really nice is each report widget can be configured to automatically fetch new data from the API at a regular interval, for example, every hour. This dramatically reduces the time it takes to see top level metrics across all your accounts.

Some of the other available features include:

  • 15 different report widgets available
  • Top/flop keywords widget (movers & shakers)
  • Drag-drop and resize report widgets
  • Update all widgets at the same time
  • Update individual widgets at set intervals
  • Use tabs for more dashboards
  • Resize report widgets
  • Notes widgets for comments
  • Add up to two Google Account Email addresses
  • FAQ Center available in English, Spanish, German

We continue to be impressed by the new solutions developers are bringing to market by leveraging the Google Analytics Platform. If you have developed a useful new tool or integration on top of Google Analytics, drop us an email at analytics-api@google.com. If it's innovative and useful we'll highlight it to our readers on this blog.


Rabu, 04 November 2009

Rapid Fire Web Analytics Q and A with Avinash and Nick - Episode #2

This is our second video in our recent initiative to ask you to share your most burning questions via Google Moderator (link: Google Analytics Google Moderator site).

This week, Avinash brings his cast (leaving only one good analysis ninja arm) and we sit down to do a rapid fire Q&A to answer your questions.

In this episode we discuss:

  • Strategies for non-bounced non-converted visitors (Macro vs. Micro conversion)
  • Ways to report total number of keywords over time
  • Benefits to tracking transactions as conversion goals
  • Tracking unique visitors to specific web pages
  • Path analysis for keyword reports -- why it's bad and what to do instead
  • How Google Analytics can be used on affiliate sites
  • How site owners can exclude themselves from being tracked by Google Analytics
  • How to properly track sites that reside on different domains but use a shopping cart on a different, common, site (cross domain tracking)


Here are links to the resources discussed in the video:

If you found this helpful, we'd love to hear your comments. If you have a question you would like us to answer, please submit a question or vote for your favorite question in our public Google Moderator site. We will answer your latest questions in a couple of weeks with yet another entertaining video.

Please add your thoughts about the Q&A via comments below. Thanks!


Selasa, 03 November 2009

New Feature Spotlight: Google Analytics for Mobile Apps

Last week, we introduced expanded mobile reporting features in Google Analytics. To help developers, this launch includes features that make it easy to see how people are using specific parts of their iPhone and Android applications. The same Google Analytics reports that provide insights into website traffic and engagement are now available for mobile apps.

As with websites, there are two basic categories of user interaction you can track: pageviews and events. Since mobile apps don't contain HTML pages, developers simply determine when their apps should trigger pageview requests. Google Analytics then aggregates this data in the Content reports to display the number of visits, session length and bounce rates. The data gives insight into how your users interacted with the app.

Developers can also track visitor actions that don't correspond directly to pageviews using Event Tracking. These user actions can include views of embedded videos, button clicks, downloads and more. App developers can then use this data to understand which features are most popular and inform decisions about which features should be promoted or prioritized for further development.

Redfin, an online brokerage for buying and selling homes, recently tested Google Analytics on their mobile application. Watch this video to learn more about their experience:


To get started using Google Analytics to understand and optimize how people use your iPhone or Android mobile app, check out the SDK and technical documentation.