Tampilkan postingan dengan label Features. Tampilkan semua postingan

Rabu, 29 Agustus 2012

Get To Your Data Faster: Announcing Shortcuts In Google Analytics

We’re pleased to announce the addition of Shortcuts to Google Analytics. Shortcuts help you get to the exact view you want of your data in GA in record time. Rather than having to go through the "find report, add segment, change, sort" process daily, with Shortcuts you can do it once, save it, and come back to it in a single click.

How to create a Shortcut


Creating Shortcuts is simple. When viewing a standard or custom report in Google Analytics, click on the “Shortcut” button found on the report’s Utility Bar:


Then, give your new Shortcut a name:


Once named, you'll be taken straight to your report in the new "Shortcuts" section in the "Home" tab. Your report configuration has been stored, and your report shows up on the left side of the screen.

The following information is saved as part of a Shortcut:
  • Standard or custom report for context
  • Currently viewed tab on the report
  • Sort order
  • Advanced segments
  • Graphed metric
Notably not saved is the date range and sample size. This is because they are very dependent on the data you are looking at.

Using Shortcuts


In the "Home" tab in Google Analytics, there is a new section called "Shortcuts". Here, you can find all of the shortcuts you’ve created, and navigate to each one. Clicking a Shortcut will "reset" the segments that are applied - so you know you'll always see the same customization every time you use a Shortcut.


If you make any changes while viewing a Shortcut and you want to have those changes persist for the next time you view the Shortcut, just click on “Save” from the report’s Utility Bar:

Managing Shortcuts


You can easily manage your Shortcuts from the Overview page, found under the Shortcuts navigation on the “Home” tab. From this page, you can also delete any of your created Shortcuts:

What else should you know?

  • Shortcuts can be emailed and exported like any other standard report.
    • Deleting a Shortcut will remove that report from any scheduled emails, as with deleting a custom report.
  • Shortcuts apply at the profile level, like the rest of reports in Google Analytics.
This is a continued step in making your experience with Google Analytics as efficient as possible. We hope you find Shortcuts a useful feature.  

Posted by Andrew Seguin, Google Analytics Team

Selasa, 24 Juli 2012

Understanding And Using Page Value

When Google launched Google Analytics many moons ago (2005 to be exact) there was a metric named $Index. It wasn’t your standard analytics metric, like pageviews or visits. It was a calculated metric to help businesses understand value of content. Unfortunately $Index was removed from Google Analytics version 5 due to some technical limitations.

But now it’s back as a new metric named Page Value!

How Page Value Is Calculated
Page Value is calculated using the value of your transactions and your goals. So even if you don’t have an ecommerce website you can still use Page Value. Just make sure you have defined some goals and assigned them a value. (If you need more information about defining and tracking conversions check out our Getting Started Fast with Google Analytics webinar).

Here’s the exact formula of how Page Value is calculated:

Page Value = (Transaction Revenue + Total Goal Value) / Unique Pageviews for the page

Page Value can also be calculated for a group of pages, like a directory. In that case the definition changes slightly.

Page Value = (Transaction Revenue + Total Goal Value) / Total unique Pageviews for the group of pages

Remember, a unique pageview is just a count of visits that include the page. If a page is viewed five times in a single visit, Google Analytics will count five pageviews but one unique pageview.

Now there are a couple of things to be aware of. The calculation does not include all transaction and goal revenue for the entire visit. It’s only the goal conversions and transactions that happen after the page is viewed, not before the page is viewed.

Enough of the math and description, let’s look at an example. 

Here are two hypothetical visits:

Visit #1 activity:


Visit #2 activity:


Here’s how Google Analytics would calculate the value of Page 1, Page 2 and Page 3.

Page 1: ($100 revenue + $40 revenue + $0 goal value) / 2 unique pageviews = $70
Page 2: ($100 revenue + $40 revenue + $0 goal value) / 2 unique pageviews = $70
Page 3: ($100 transaction revenue + $0 goal value) / 1 unique pageviews = $100

How to Use Page Value
Page value is a measure of influence. It’s a single number that can help you better understand which pages on your site drive conversions and revenue. Pages with a high Page Value are more influential than pages with a low Page Value.

Get started by reviewing the Page Value column in the Content > All Pages report.


Your site probably has a lot of pages. Here’s a tip, use the Advanced Table Filter in the content report to remove some of the noise from this data. You can set up a filter to exclude pages with a Page Value of 0 or less than 30 pageviews. 

If you’re an ecommerce company you’ll immediately notice that the most valuable pages on your site are your checkout pages. This makes sense because everyone needs to view the checkout pages before converting.

Start by looking for pages that get a lot of traffic (pageviews) but have a low Page Value. Why don’t these pages help conversion? Should they? Use some of the other metrics, like Avg. Time on Page, Bounce Rate  or Exit Rate to get a better picture of the user experience on this page. 

If people are using the page, but not ultimately converting you may want to use some of the other content tools, like Flow Visualization, to get a better understanding of their experience after using a piece of content. 

Also look for pages that get a low volume of traffic but have a high Page Value. These pages are influential but don’t get a lot of attention. You might consider promoting them more via an external marketing campaign (email, PPC, social media) or an internal campaign (homepage banner, etc.).

If you work in SEO then you should definitely check out the Page Value for the content you are optimizing.

Page Value is not a silver bullet. It does not magically generate more conversions for your business. But it is an actionable metric that can help you understand the behavior of your visitors.

Posted by Google Analytics Advocate Justin Cutroni

Jumat, 29 Juni 2012

Measuring a Mobile World: Introducing Mobile App Analytics

Mobile is changing the way that people communicate, work and play, and much of the growing adoption and innovation we're seeing in the industry is driven by mobile apps. There are already more than 600,000 mobile apps on Google Play alone, and we expect to see continued momentum throughout the industry. Mobile is also becoming front and center for marketers and businesses. As more of them understand the value of mobile apps, sophisticated measurement tools are becoming core to how marketers and app developers invest, analyze and market their apps. 

That’s why today we’re announcing a new set of reports in beta called Mobile App Analytics that help marketers and developers better measure their mobile apps. The reports are tailored for mobile app developers and marketers, speaking the language that matters to them. They are designed to measure the entire mobile customer journey - from discovery to download to engagement. This enables the creation of app experiences that are more useful and engaging through data-driven decisions at each stage of the app lifecycle:
  1. Acquisition and user metrics such as downloads and new users
  2. Engagement metrics such as retention, crashes and conversions
  3. Outcome metrics such as app sales and in-app purchases


Layout of new Mobile App Analytics reports

Here’s an outline of the new Mobile App Analytics along with screen grabs of selected reports:

Acquisition and User Analysis Reports - discover your best sources of new users

New and active users - measure the number of new and active users who launch your app everyday and analyze your most valuable segments. 


Google Play traffic sources - understand which traffic sources are driving new users and in-app conversions through Google Play to fine-tune your marketing initiatives. 

App versions - keep track of the distribution of active users over the older and newer versions of your app so you know what to support.

Device overview - check out the top mobile devices and OS versions that your app runs on, and optimize the experience for each device.

Engagement Reports - see how users interact with your app

User behavior - assess how loyal your users are, how frequently they use the app, and the engagement level of each loyalty group.

Engagement flow - visually see the screens, actions and paths users take to move throughout your application in order to optimize usage.

App crashes - see trends in crashes and exceptions that will help you troubleshoot problems on certain devices and operating systems.

Outcome / Business Impact Reports - identify whether users are accomplishing your goals

Goal conversions - set up conversion events in your app, like spending 10 minutes in the app, or clicking on ads to gauge success.


In-App purchases - if you sell virtual or tangible goods in your app, you can measure the number of purchases and the revenue generated.

The new reports are part of a holistic experience tailored for mobile app measurement, including a new and lightweight SDK v2.0 that’s easier to implement and is opt-out ready, with a streamlined back-end infrastructure.

We’ve also revamped our sign-up process, so new users can choose whether they want to start measuring their website or their mobile app. This means you’ll be just 3 clicks away from setting up your app analytics account and downloading the SDK.

We will be opening the beta up to whitelisted users in waves, so if you’re interested in using Mobile App Analytics for your app, please complete this beta signup form and we’ll get you started soon. We anticipate the reports will be available to all Google Analytics users by the end of the summer.

Also, if you are at Google I/O be sure to attend the Google Analytics session “Measuring the End-to-End Value of Your App” (from 11:30AM - 12:30PM today, June 29) where our lead engineers will tell you more about Mobile App Analytics and some other exciting things we’re working on.

Posted By JiaJing Wang, Product Manager, Google Analytics Team

Selasa, 26 Juni 2012

Workflows Simplified - Introducing Flow Viz PDF Export and Alerts Widget

GA users have voiced their feature requests around Flow Viz, and we’ve listened. The team is very happy to introduce a new feature for Flow Viz: PDF Export.


The PDF export will respect your interactions within the flow. If you highlighted a connection, or changed the dimension, the exporter will print those out as well in color.

This feature can be found in all Flow Viz reports, including the Visitors Flow, Goal Flow, and Events Flow. You can go to your favorite Flow Viz reports and check it out now.

Besides PDF export, we’ve also been working on another useful feature. 

Ever wished that you have easier access to your alerts? What about a quick glance at the trend of your alerts, to see if there are any anomalies? Look no further. The GA team has been hard at work to bring the new alerts widget to your GA dashboard.


This new widget gives you a view on the number of automatic and/or custom alerts that you had over the date range selected. If you click on the widget, it will lead you to the intelligence events report, simplifying your workflow. 

This widget will automatically be included in all your newly created dashboards if you select the “starter dashboard” option. In addition, if you have already created a customized dashboard and would like to add this new feature, you’ll be able to find the alert widget under the TIMELINE visualization. 


Under the “Add a metric” drop down menu, you’ll be able to choose “All Alerts,” “Automatic Alerts,” or “Custom Alerts.” To learn more about alerts, please check out our help contents page.

Thank you for giving us your continuous feedback, and we hope these new features will help simplify your analytics workflows. Please reach out to us with questions and comments, and we are always happy to take additional feature requests under consideration.

Posted by Jerry Hong, Google Analytics team

Rabu, 06 Juni 2012

Building Blocks of Digital Attribution: How to get started with Google’s attribution tools


What are the key steps to getting started with marketing attribution? Are you ready to move beyond the “last click” attribution model? How can you use Google’s tools to better understand your customer’s journey and calculate the impact of your digital marketing channels?


To help answer these questions, we’ve put together a series of webinars on attribution:
If you didn’t have a chance to catch last week’s webinar on Building Blocks of Digital Attribution, it’s a great place to start your attribution journey -- you can watch the recording above. During the webinar, Bill Kee, Product Manager for Attribution and Multi-Channel Measurement, discussed how to lay the foundation for digital attribution. First and foremost, it’s important to get your organization ready. In our work with customers and our recent attribution research, we’ve discovered that many companies try to pursue attribution before their culture or their data is ready. In the webinar, Bill describes the steps and the potential pitfalls to make sure your company is heading in the right direction.

Second, even if the organization has taken the necessary steps culturally, it’s challenging to find the right technology, and to ensure that technology is properly implemented.


We know that finding the right technology is a challenge, which is why Google offers several great attribution tools – including AdWords Search Funnels, Multi-Channel Funnels in Google Analytics, and Attribution Modeling in Google Analytics Premium. In order to get the most out of these tools, it’s important to ensure that the basics are set up correctly.  So, during the webinar, Bill also did a live demo of how to get started with AdWords Conversion Tracking and Google Analytics Goals. The setup is quick and easy – and once it’s in place, users can start accessing rich attribution data.

Naturally, we also received a lot of great questions from the webinar participants. We weren’t able to get to all of them during the webinar, so here are some responses and more pointers on getting started with attribution.


How do you define “digital attribution”?
Digital attribution is the process of assigning credit to the various online interactions your customer has before a “conversion” (conversion = making a purchase or performing some other valuable action on your site). These interactions could include display ads, paid or organic search results, email campaigns, affiliate coupon programs, social network posts, and other digital interactions. Today, many marketers by default use “last click” attribution, assigning all of the credit to the last interaction before a conversion. By understanding the full path to conversion – including early “upper funnel” touch points – and giving credit to all of those interactions, you’ll be able to budget more effectively and design better marketing campaigns.

What about attribution beyond digital channels?
Attribution is about improving the measurement of how ad spend drives conversions. To address this challenging topic, it’s important to consider all the factors that might affect conversions. These factors include the digital channels mentioned above, as well as how users interact with your brand across multiple devices, and the influence of online advertising on offline sales. This webinar series is focused on how to get the most out of digital attribution.

How do I know which interaction is the trigger for the actual conversion, out of the entire funnel?
The goal of attribution is to more accurately measure the impact of all your digital channels on sales, including how these channels interact in the path to conversion. This means acknowledging that, in most cases, there is no single “trigger” for the conversion, but rather a group of campaigns or touch points working together to help drive a conversion. So, a user might see a display ad which makes her start thinking about your product, then a few days later view an organic search result, then receive a targeted email, and finally buy your product. In this example the email was the last pre-conversion interaction, but all three interactions probably had an impact on your customer’s decision. Attribution is the process of deciding how much credit you want to give to each of those interactions.

How do I set up those tools you discussed during the webinar? Can you provide more detail for advanced setup needs?
Our help center provides very detailed information about how to get your AdWords and Analytics set up correctly, and responses to frequently asked questions. Check out our pages on:


In addition, if you'd like more help, we recommend contacting one of our certified partners – they can assist you with all aspects of implementation, as well as with interpreting your results. You can also check out our AdWords user forum and our Google Analytics user forum to get answers to your questions.

Does adding all this code to my website affect the site speed at all?
If the code is installed correctly by following the directions outlined on our help center pages (see above for links), it should not impact your site speed, or have only a very tiny impact. Setting up goals and conversion tracking will provide much richer data on how users arrive at your site and whether they’re doing what you want them to do once they get there. With that knowledge, you’ll be able to improve your marketing programs and your website.

What are some sample use cases for “event” goals?
A goal or a conversion can be more than just a purchase. Indeed, you can define multiple “micro-conversions” that represent various actions that are important to your business. So, you might use event goals to keep track of when a PDF was downloaded, or when a user watched a video or played an audio clip. Each of these “events” could be tied to goals that are of value to you. You can find more detail about event tracking in this article on the Google Developers site.

Why do I need to set up conversion tracking and goals? Can’t Google Analytics track without conversions?
It is possible to see some useful information without conversions, but defining conversions helps you measure what's important, rather than just general behavior. Plus, after you have these conversion tools set up in Analytics and AdWords, you’ll be able to access Multi-Channel Funnels, Flow Visualization, and Conversion Reporting in Google Analytics, as well as Search Funnels and Conversion Optimizer in AdWords. It’s quick and easy to get started, and it’s much more useful to look at a user’s path if you know that they’ve reached your desired end point and performed an action that’s valuable to your business.

Marketing attribution is a complex but very rewarding process – we hope that these tools and webinars will help you to get started.

Happy analyzing, and hope you'll join us for the next webinar in the series!

Sara Jablon Moked, Product Marketing Manager for Conversion and Attribution

Senin, 04 Juni 2012

[New Feature]: Conduct Browser-Size Analysis Within Google Analytics

We’re pleased to announce a new tool for optimizing your site’s content: browser-size analysis, which is part of the In-Page Analytics report.

Browser Size

Today’s visitors to websites are using an ever-growing number of devices. Many users are on mobile platforms, and although desktop monitors are getting bigger, browsers aren’t necessarily following suit. For many people, the visible portion of the web page is much smaller than the screen resolution, because of excessive toolbars and other clutter.

What is actually “above the fold” on a web page is a significant factor to conversion rates. If visitors have to scroll to see an “add to cart” button, or some other critical element, they may never get around to it. Analyzing the percentage of visitors for whom page elements fall beneath the fold or off to one side is difficult, so we've created a visualization that lets you quickly determine which portions of your page are visible to which percentages of visitors.

Simply navigate to the Content section in Google Analytics, and click In-Page Analytics. A new information layer is available (we’re rolling out the feature gradually over the next few weeks, so please be patient if you don’t see it yet!). Click Browser Size to shade portions of the page that are below the fold. You can now click anywhere on the screen to see what percentage of visitors can see it, or control the threshold percentage by using the slider.


Conversion insight

Click Show percentiles to see a summary visualization of several different percentiles. This helps you understand how browser sizes are distributed--for example, if you choose to compare All Visitors with the Mobile traffic segment, you should see a substantial difference. You can also use this technique to compare different pages on your site. For example, if users on your goal page appear to have larger browsers than those on your landing page, this is a strong indicator that you are losing conversions because some pages in the funnel are not laid out in an optimal manner.

By default, the report shows you data based on the current page you are viewing (and the active advanced segment). You can use the picker to also view data for “visitors to the site” or “Web users” so you can compare it to different benchmarks. Note that these modes disregard advanced segments. The Web data source is aggregated by Google over many users.


Graduation

You may have used an earlier iteration of this tool at http://browsersize.googlelabs.com/. Now that the lab has succeeded and we’re offering a more powerful for your own site tool within Google Analytics, we will be sunsetting the original tool in approximately one month.

Posted by Gaal Yahas, Google Analytics team

Jumat, 01 Juni 2012

Helping to Create Better Websites: Introducing Content Experiments

Over the last 5 years, it’s been great to see how many marketers and publishers have improved the web by using insights from Google Website Optimizer to create better site experiences. Today, we’d like to announce the release of Google Analytics Content Experiments, which brings website testing to Google Analytics.

We’re excited to integrate content testing into Google Analytics and believe it will help meet your goals of measuring, testing and optimizing all in one place. Content Experiments helps you optimize for goals you have already defined in your Google Analytics account, and can help you decide which page designs, layouts and content are most effective. With Content Experiments, you can develop several versions of a page and show different versions to different visitors.  Google Analytics measures the efficacy of each page version, and with a new advanced statistical engine, it determines the most effective version. You can watch this video to learn more:


Testing and experimentation of websites may sound complicated, but we've worked hard to provide a testing tool that makes it as easy as possible:

  • Content Experiments comes with a setup wizard that walks you step by step through setting up experiments, and helps you quickly launch new tests.
  • Content Experiments reuses Google Analytics tags so that you only need to add one additional tag to the original page.
  • Content Experiments helps you understand which content performs best, and identifies a winner as soon as statistically significant data has been collected.
  • Since content testing is so important, we’ve placed Content Experiments just a click away from your regular diagnosis reports in Google Analytics.

With full integration in Google Analytics, we’ll be able to grow and evolve website experimentation tools within our broader measurement platform. Initially, you’ll be able to utilize important features like optimized goal conversions, easier tagging, and advanced segmentation in reports. We’re also working hard to release page metrics, additional goal conversion options and experiment suggestions.

Since we’re rolling much of the Google Website Optimizer functionality into Google Analytics, it’s time for us to say goodbye to the standalone tool. The last day you’ll be able to access Google Website Optimizer, and any reports for current or past experiments, will be August 1, 2012. We encourage you to start any new experiments in Content Experiments. For those of you that are new to website experimentation, we hope you’ll try out the new Google Analytics Content Experiments.

This is just the first step we’re taking to simplify website testing, and we look forward to integrating more features into the experimentation framework of Google Analytics. Content Experiments will be gradually rolling out over the next few weeks to all users. Once available in your account, you can start testing by going to Google Analytics and accessing Experiments within the Content section of your reports.

We’ll continue to have a strong network of Google Analytics Certified Partners who will be able to provide advanced support for Analytics, including Content Experiments. If you would like professional assistance in designing, implementing, or interpreting the results of a test, simply go to the Google Analytics Partner page and select "Website Optimizer" from the Specialization menu.  You can also find more information in our help center. Please try out Content Experiments and let us know what you think.

Happy testing!

Posted by Nir Tzemah, Google Analytics team


Kamis, 24 Mei 2012

Social Reports are now found under 'Traffic Sources'

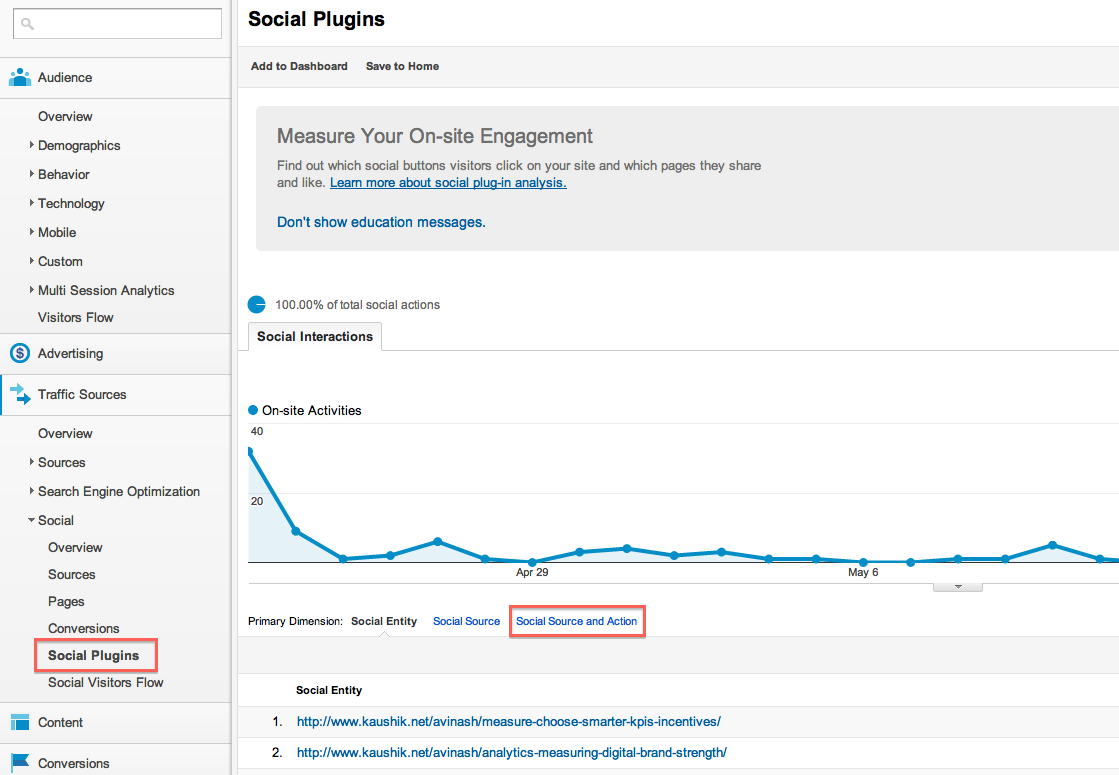
We’ve recently consolidated the locations of our social reports. The 3 reports, Social Engagement, Social Actions, & Social Pages were previously listed in the Audience section and have been moved to the Traffic Sources -> Social section. Click through to see the reports in your Analytics Account.

In addition we’ve added new social reports and functionality, as detailed on our recent blog post on the launch of our Social Reports. Users now have access to both onsite behavior, the existing data, and off-site social activities of partners such as Google+, Digg, and Reddit among others. Below is a summary of how to access the data from the old reports in the new ones.

To access onsite activities use the Traffic Sources -> Social -> Social Plugins report. Here you see the social activities broken down by content. Selecting a specific page shows you the social activities by network for that page. Click the “Social Source and action” tab highlighted in the screenshot below to see a breakdown of the itemized activities.


Hope you’ll find this information helpful and learn more about how social channels are delivering value to your website.

Posted by Linus Chou, Google Analytics Team

Kamis, 03 Mei 2012

Expanding Google Analytics Social Reports: Tracking Links To Your Site Content

Have you ever wondered which other pages on the web link to your own? Wouldn’t it be nice to know which sites are talking about your content, and in which context? Well, a problem no more: now you can see all the backlink URL’s, post titles, and more right within the new Social reports.

The concept of trackbacks, a protocol by which different sites could notify each other of referencing links, first emerged back in 2002. Since then, the blogosphere has grown in leaps and bounds, but the requirement for each site to explicitly implement this protocol has always stood in the way of adoption. If only you could crawl the web and build an accurate link graph. The good news is we already do that at Google, and are now providing this insight to Google Analytics users.


If you’re not familiar with Trackbacks, then think of it as automated Google Alerts for all of your pages: you publish new content, we scour the web for pages that link to it and build automated reports for you right within Google Analytics - simple as that.

These reports provide another layer of social insight showing which of your content attracts links, and enables you to keep track of conversations across other sites that link to your content. Most website and blog owners had no easy mechanism to do this in the past, but we see it as another important feature for holistic social media reports. When you know what your most linked content is, it is then also much easier to replicate the success and ensure that you are building relationships with those users who actively link to you the most.

To learn more about the new Social and ROI reporting, take a look at our announcement last month, and also take a look at in-depth example of how to use these new reports to measure your user’s engagement in Google+.

Rabu, 02 Mei 2012

Marketing Attribution: Questions and Answers

Last week, we hosted a webinar on marketing attribution. We had a lively discussion about our recent attribution whitepaper, and we looked at Google’s solutions for attribution -- including Search Funnels in AdWords and Multi-Channel Funnels in Google Analytics, and the Attribution Modeling Tool in Google Analytics Premium. During the webinar, many of you wrote in with great questions, and we’ve provided answers below to some of the top questions.

If you weren’t able to join us last week, you can view a recording of the webinar here.

Questions & Answers:
Q: How can I learn more about getting started with attribution using Google’s tools?
A:This webinar was the first in a series on attribution -- please watch the blog for updates and registration information for our next webinar, “Building Blocks of Digital Attribution.” In the meantime, read on for some more tips.

Q: Where can I learn more about setting up conversions?
A: Setting up conversion tracking in Google Analytics is one of the most valuable things you can do to make your reports actionable and meaningful, and getting these set up properly will allow you to use Google’s attribution solutions. There are resources available in the help center to help you set up goals and ecommerce tracking. You can also view the recording of our recent “Reaching your goals with Google Analytics” webinar.

Q: When should I use AdWords Search Funnels compared to Google Analytics Multi-Channel Funnels? 
A: Both tools can give you insight into how your customers ultimately end up converting on your site. If you are using AdWords Conversion Tracking today, Search Funnels is available without any additional configuration. You can see the interactions your customers have with your search ads leading up to conversion, including both clicks and impressions. However, you can only see these interactions for paid search on Google AdWords.

Multi-Channel Funnels in Google Analytics allows you to analyze traffic sources beyond search, including display, social, email, referrals, affiliates and more - putting your conversion path data in a broader context. Using these reports requires installing Google Analytics tracking code on your site, and setting up goals and/or ecommerce tracking (see links above) -- once these are set up, Multi-Channel Funnels reports work automatically. Note that you  are not able to analyze search ad impressions in Multi-Channel Funnels.

Watch this blog for updates on future webinars in our attribution series that will provide more details on Search Funnels and Multi-Channel Funnels.

Q: How much of an impact does the use of multiple devices have in skewing the numbers we see in these reports? 
A: Mobile and other devices are becoming increasingly important. Multi-Channel Funnels will report on conversion paths that take place on a single device, but not across devices. For example, if a user visited your site on a mobile phone, and then completed a purchase in a desktop browser, those interactions would not be included in the same conversion path.

Q: Can I report on both AdWords Keyword and Matched Search Queries in Google Analytics?
A: You have the option to view either the AdWords Keyword or the Matched Search Query by choosing these dimensions in the data table. Multi-Channel Funnels and Attribution Modeling support a wide range of AdWords and non-AdWords dimensions for reporting and creating attribution modeling rules.

Q: Can you add your own models to the Attribution Modeling Tool or they are all built in? 
A: You can create and save custom models in the Attribution Modeling Tool in Google Analytics Premium. Custom models allow you to create rules that adjust credit based on attributes like the traffic source (e.g. search vs. direct), position (first, middle, last) the level of engagement driven (time on site and page depth), and timing (how much time prior to conversion).

Q: How do advertisers take action on attribution data?
A: Attribution data can help advertisers identify marketing efforts that may be undervalued or overvalued under models such as the last click, so they can adjust their marketing programs. For example, a general keyword like “shoes” may show fewer conversions compared to a more specific, branded term for a type of shoe on a last click basis. However, applying a model that gives some credit for searches prior to the last click may show that “shoes” is credited with more conversion value. When making optimization decisions around which keywords to invest in or cut, advertisers can look at multiple models, and then experiment with investing in keywords that show higher value under alternative models. Similar methods apply to channels like display, social, email, and affiliates. This can help identify areas of opportunity that are missed when using only the last click.

Happy Analyzing!


Selasa, 24 April 2012

More ways to measure your website's performance with User Timings

As part of our mission to make the web faster, Google Analytics provides Site Speed reports to analyze your site’s page load times. To help you measure and diagnose the speed of your pages in a finer grain, we’re happy to extend the collection of Site Speed reports in Google Analytics with User Timings.

With User Timings, you can track and visualize user defined custom timings about websites. The report shows the execution speed or load time of any discrete hit, event, or user interaction that you want to track. This can include measuring how quickly specific images and/or resources load, how long it takes for your site to respond to specific button clicks, timings for AJAX actions before and after onLoad event, etc. User timings will not alter your pageview count, hence,  makes it the preferred method for tracking a variety of timings for actions in your site.

To collect User Timings data, you'll need to add JavaScript timing code to the interactions you want to track using the new _trackTiming API included in ga.js (version 5.2.6+) for reporting custom timings. This API allows you to track timings of visitor actions that don't correspond directly to pageviews (like Event Tracking).  User timings are defined using a set of Categories, Variables, and optional Labels for better organization. You can create various categories and track several timings for each of these categories. Please refer to the developers guide for more details about the _trackTiming API.

Here are some sample use cases for User Timings
  • To track timings for AJAX actions before and after onLoad event. 
  • A site can have their own definition of “User Perceived Load Time”, which can be recorded and tracked with user timings.  As an example, news websites can record time for showing the above fold content as their main metric instead of onLoad time. 
  • Detailed performance measurement and optimization of sub components on a page, such as time to load all images, CSS or Javascript, download PDF files and time it takes to upload a file.
Want to check out User Timings Report in your account?
Go to the content section and click the User Timings report under Content section. There are three tabs within the User Timings report for you to review: Explorer, Performance, & Map Overlay. Each provides a slightly different view of user timings reported.

The Explorer tab on the User Timings report shows the following metrics by Timing Category, Timing Variable, or Timing Label (all of which you define in your timing code).
  • Avg. User Timing—the average amount of time (in seconds) it takes for the timed code to execute
  • User Timing Sample—the number of samples taken
The Explorer tab also provides controls that you can use to change the tabular data. For example, you can choose a secondary dimension—such as browser— to get an idea of how speed changes by browser.

To learn more about which timings are most common for user timings, switch to the Performance tab. This tab shows timing buckets, providing you with more insight into how speed can vary for user reported timings for selected category, variable and label combinations. You may switch to Performance tab at any point of navigation in the Explorer tab, such as after drilling down on a specific category and variable, to visualize distribution of user reported timings.  The bucket boundaries for histograms in Performance Tab are chosen to be flexible so that users can analyze data at low values ranging from 10 milliseconds granularity to 1 minute granularity with addition of sub-bucketing for further analysis.


The Map Overlay tab provides a view of your site speed experienced by users in different geographical regions (cities, countries, continents).

-  Satish Kambala & Mustafa M. Tikir, Google Analytics team

Jumat, 20 April 2012

Webinar: Marketing Attribution: Insights from Google Analytics and Econsultancy

Please join us next Thursday for a webinar on marketing attribution featuring Bill Kee, our Product Manager for Attribution, and Stefan Tornquist, VP for Research at Econsultancy.

Stefan will talk about insights from the recent Attribution whitepaper by Econsultancy and Google Analytics, and Bill will discuss Google’s approach to attribution and some of the tools we offer, including Search Funnels in AdWords and Multi-Channel Funnels in Google Analytics. Plus, he’ll demo the Attribution Modeling Tool in Google Analytics Premium.


We'll also provide a few tips for how to get started with attribution. This webinar will be the first in a series on attribution -- so please stay tuned for future installments!

Date: Thursday, April 26
Time: 10:00am PT / 1:00pm ET
Click here to register

We hope you’ll be able to join the live webinar, but for those who can’t make it, we’ll be sharing a recording after the event.

Selasa, 03 April 2012

Better results, (still) early adoption: Marketing attribution in a complex digital landscape

Today, we’re sharing some research on marketing attribution that we conducted in partnership with Econsultancy, a leading digital market research firm. The insights -- Marketing Attribution: Valuing the Customer Journey -- provide a snapshot of how marketers and agencies are conducting attribution, the impact it has, and the barriers holding them back.

If you’re not familiar with digital attribution, it’s about distributing credit to all of the elements of your digital marketing program, so you can gauge the impact of customer marketing interactions on your sales results and make more accurate investment decisions. Here are a few snippets from the report that we found interesting:

It’s still a new craft, but early results show positive impact
Although digital attribution is still relatively new -- 83% of practitioners we surveyed have been using it for less than 2 years -- it clearly has a positive impact on businesses that employ it. 72% agree that it leads to better budget allocations, 63% gained a better understanding of how digital channels work together, and 58% had clearer insights into their audience: 

Attribution leads to improved ROI, better budgeting


Last click attribution dominates; agencies are leading the way in experimentation
Most digital marketers run multiple campaigns, each with different strategies and objectives. For instance, display campaigns that are designed to generate awareness will have a different impact on sales than paid search campaigns designed to bring in buyers. Yet most marketers today still use attribution models that do not account for these differences in strategy. Although only 14% of respondents consider “last click” attribution to be “very effective,” it remains common; most likely because marketers haven't yet found or mastered the right attribution tools. Digital marketing agencies have done more with sophisticated attribution methods and technologies:


Robust attribution leads to confident digital decisions
For organizations that use attribution, it often leads to greater confidence in marketing choices: if you know the impact of your programs, it’s easier to budget for them. As one online retailer commented, “Attribution was the missing piece to our campaign analysis. Now we don’t run a campaign without learning something about how our marketing affects the buying cycle, and then testing to see whether it applies in the long run.”

Performing marketing attribution with Google
Here at Google we spend our time building intuitive tools to make measurement easier, so that you can really use your data to make smarter decisions. That’s why we provide several important tools for marketing attribution, including Search Funnels in AdWords and Multi-Channel Funnels in Google Analytics. And check out our Attribution Modeling tool in Google Analytics Premium, which includes five standard attribution models plus a custom model builder, so you can create and customize attribution models in minutes, and see data instantly. Learn more in our Attribution Playbook.

Join us for an Attribution Hangout
If you’re available this Friday, April 6, at 9:00am PDT, please join Bill Kee, Product Manager for Attribution, and Justin Cutroni, Analytics Advocate, for a Google+ Hangout. Bill will talk about the research and give a demo of the Attribution tool in Google Analytics Premium, as well as discussing Multi-Channel Funnels and AdWords Search Funnels, two complementary features.

To watch the Hangout on Air, tune into Justin’s Google+ Page on Friday. If you have a question that you would like us to discuss, please enter it in this this form -- and we’ll invite five of you to join the Hangout live to ask your questions.

We look forward to seeing you at the Hangout on Friday!

Sara Jablon Moked, Product Marketing Manager, Conversion and Attribution

Senin, 02 April 2012

Share reports by email and export to PDF: now live in the new Google Analytics

The new Google Analytics has come a long way since it was first unveiled last March. Between multi-channel funnels, real time, flow visualization, premium, and a whole host of other incredible features, it is hard to believe that only a year has gone by.

We are excited to announce that Analytics reports can now be automatically sent to yourself or other members of your team from within the new Google Analytics. These reports can be set up to email at a variety of regularly scheduled times, including daily, weekly, monthly, and quarterly. Reports can also be exported to PDF allowing you to save or share the insights you’ve found using Google Analytics.

Where to find Email and PDF export
Look in the newly-redesigned Utility Bar located at the top of your favorite reports for Email and PDF Export options:


In order to provide maximum flexibility, this functionality is available on standard reports, custom reports, and dashboards. Clicking on the "Email" button on a dashboard pulls up the same email scheduling dialog as in standard reports and offers the same feature set:


Why "beta"?
For those who have used the email scheduler in the old interface, this new emailer system operates independently and has enhancements in reliability and ease of use. We are putting the finishing touches on the look and feel of exported reports, and anticipate that these will be finalized soon.

Part of the transition to the new emailing system is an opportunity to "reset" your scheduled emails. Consider which scheduled emails have been most helpful and be sure to recreate those in the new interface. The new Google Analytics has some reporting differences and additional metrics that you may want to take advantage of when drafting new scheduled emails. We will provide ample notice before scheduled emails from the old Google Analytics are sunset later this year.

We would love to hear how the release of these features helps you to be efficient and derive valuable insights. Let us know your thoughts in the comments. Happy exporting!

Jumat, 23 Maret 2012

Measure your website’s performance with improved Site Speed reports

In our continued effort to improve your experience of Google Analytics, we are excited to release an updated Site Speed report that distills all the key metrics into a quick & easy to read Overview report.

Site Speed Overview Report
The Overview report provides an at-a-glance view of essential information for measuring your site’s page loading metrics: Avg. Page Load Time by Browser, Country/Territory, and Page. Plus you can compare your site’s average performance over time to forecast trends and view historical performance. All of these tools can help you identify where your pages may be underperforming and adjust so more visitors land on your site instead of waiting in frustration or leaving.
Example of updated reports   

Previously there was only one Site Speed report, this has been renamed to “Page Timings”. On the Page Timings report, you can view your site's load times in three ways: use the Explorer tab to explore average load time across dimensions, use the Performance tab to see how the load times break down by speed ranges, or use the Map Overlay tab to see how the load times breakdown by geography.

Previous report, now Page Timings   

Speed metrics available in Intelligence Reports & API
The technical metrics included in the Page Timings report were launched a couple of months ago. So we’ve been working hard at making these metrics available in more of your favorite Analytics features. We’ve updated the Intelligence Reports to include the average site load times and all the Page Timings metrics. Now you can create custom alerts based on site speed metrics such as Avg. Page Load Time, Avg. Server Response Time. And view site speed metrics in the Analytics API and Custom Reports.

Site Speed Sample Rate
Small sites (<10K visits per day) can now increase the site speed sample rate up to 100% to get full samples for page load time. Note that the processing limit of up to 10K per day or 1% of pageview hits (whichever is greater) still applies.

- Mustafa M. Tikir, Google Analytics team

Kamis, 22 Maret 2012

Better Insights with Flow Visualization Enhancements

We've been listening to your feedback about Flow Visualization, and we’re excited to announce a number of significant upgrades that are available to all our users starting today.

Events Flow
We’ve expanded the Flow Visualization family of reports to now include Events Flow! This new feature can be found in the Content->Events section:

What problem does Events Flow help solve?
Event-driven websites had a difficult time analyzing the impact from their visitors using flow visualization. These are websites that land users on one URL, where there are multiple elements on that page for a user to interact with  (such as videos, roll over buttons, or games). These sites tend to have very few pages and get most of their value from visitor interactions with events. The Events Flow report addresses this issue by showing the order of events in which your visitors engaged.


For those who have used Visitors Flow before, the feel of the Events Flow report will be familiar - it includes all the same interactions of hovering, clicking, and adding additional steps. You can also analyze the flow of events by grouping the nodes in any of the following 3 options: Category, Category/Action, or Category/Action/Label.  For more information about using the Events Flow report, view our help center or this how to video to see how we analyzed the events that occurred in our very own Flow Visualization reports!

Flow Visualization Date Comparison
You can now compare two date ranges for the entire family of Flow Visualization reports: Visitors Flow, Goal Flow, and even the new Events Flow. This feature will help you to gain insights on how your visitor engagement changes over different periods of time.

Example of Goal Flow Date Comparison

Now you can analyze and measure how changes to your pages and/or goal steps affect your visitors behavior. It optimizes your workflow by removing the need to perform manual calculations and open two browsers to view two flow visualizations side-by-side. You can now do them all in one screen.

Plus, you can also highlight connections and instantly update all the comparison numbers for that particular traffic. Below is a real-life example from our Google Store. We compared two time periods (where we have removed a particular goal step) and discovered that pageviews from Firefox went down 15%.

From an initial impression, one might have concluded that the removal of the goal step could have potentially lower the traffic. However by highlighting that flow we were able to isolate that traffic to see how many orders were successfully completed. That was how we learned the number of orders actually went up 67%, and the removal of the goal step helped increased our conversion rates!

This feature can be extremely powerful for gaining additional insights on how to optimize conversions and the website experience for your visitors. Learn more in our help center.

Additional Goal Types in Goal Flow 
Are you interested in seeing how users convert on non-URL goals? Now you can, we’ve added support for additional types of goals including time on site and engagement in the Goal Flow report. Head on over to the Goal Flow report to choose the goal(s) you’re interested in.

Here are links that will help you easily find these reports in your Google Analytics account.
We hope these enhancements make Flow Visualization even more comprehensive and allow you to gain deeper insights. Please reach out to us with questions and comments, and we are always happy to take additional feature requests.

- Jerry Hong, Google Analytics team
Selasa, 20 Maret 2012

Capturing The Value Of Social Media Using Google Analytics

Measuring the value of social media has been a challenge for marketers. And with good reason: it’s hard to understand exactly what is happening in an environment where activity occurs both on and off your website. Since social media is often an upper funnel player in a shopper’s journey, it's not always easy to determine which social channels actually drive value for your business and which tactics are most effective.

But as the social industry matures, marketers and web analysts need true outcome-oriented reports. After all, although social is growing in popularity, brand websites - not social networks - remain the place where people most often purchase or convert. 

That’s why we’re releasing a new set of Social reports within Google Analytics. The new reports bridge the gap between social media and the business metrics you care about - allowing you to better measure the full value of the social channel for your business. We wanted to help you with 3 things:
  • Identify the full value of traffic coming from social sites and measure how they lead to direct conversions or assist in future conversions 
  • Understand social activities happening both on and off of your site to help you optimize user engagement and increase social key performance indicators (KPIs)
  • Make better, more efficient data-driven decisions in your social media marketing programs

The Social reports allow you to analyze all of this information together and see a more complete picture of social impact than often used today. Here are a couple of the things you can do with our new reports:

Overview Report: see social performance at a glance and its impact on conversions


The Overview report allows you to see at a glance how much conversion value is generated from your social channels. The Social Value visualization compares the number and monetary value of all your goal completions against those that resulted from social referrals - both as last interaction, and assisted.

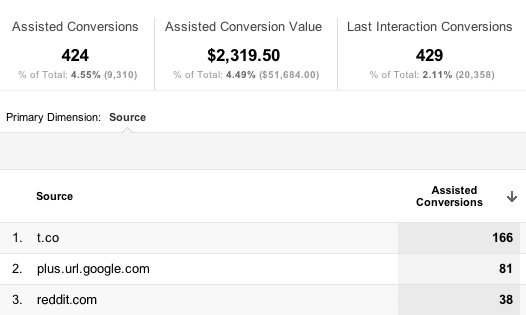
A visit from a social referral may result in conversion immediately or it may assist in a conversion that occurs later on. Referrals that lead to conversions immediately are labeled as Last Interaction Social Conversion. If a referral from a social source doesn’t immediately generate a conversion, but the visitor returns later and converts, the referral is included as an Assisted Social Conversion. 

Conversions Report: which goals are being impacted by social media


With the Conversions report, marketers can now measure the value of each individual social channel by seeing the conversion rates of each social network and the monetary value they drive to your business.

For example, you can see the effect that social content (i.e. a new video you created) had on conversions. Look at the time graph to see whether Goal Completions via Social Referral peaked after the content was published. Remember that you need to define goals and goal values in order to see data in this report, so tailor it to the things that matter to your business. Networks with a higher assisted / last interaction conversions ratio provide greater assisted conversions.

Social Sources - find out how visitors from different sources behave


The Social Sources report shows engagement and conversion metrics for each social network so you can see how people are interacting with your content and whether it’s leading to a desired outcome.

For example, if you run social campaigns that promote specific products, you can see via the Social Visitor Flow whether visitors from each social network entered your site through these product pages and whether they continued on to other parts of the site or whether they exited.  

Social Plugins: find the content that’s good enough to share


If you publish content, you'll want to know which articles are most commonly shared or recommended, and on which social networks they're being shared. The Social Plugin report shows which articles on your site are receiving the most engagement and which social buttons - for example, Google +1 - are being clicked to share them. 

You can use this information to create more of the type of content that's popular with your visitors, and test different layouts of social sharing buttons to improve use by your community. 

Activity Stream: what’s happening outside of your website

While the other reports show you the impact that social engagement is having on your site, the Activities Stream tab (located within the sources report) shows how people are engaging socially with your content off your site across the social web. 

For content that was shared publicly, you can see the URLs they shared, how and where they shared (via a “reshare” on Google+ for example), and what they said. Currently, activities are reported for Google+ and across a growing list of our Social Data Hub partners including recently signed brands Badoo, Disqus, Echo, Hatena and Meetup.

These new social reports will be available for all users over the next few weeks under the Standard Reporting Tab - please take a look and tell us what you think.

Posted by Phil Mui, Group Product Manager