Selasa, 30 November 2010

Optimize And Analyze For Mobile, part 2

This is part 2 of a timely 3 part guest post on mobile analytics strategy and implementation by Feras Alhlou at E-Nor, a Certified Partner in Northern California. Here's part 1, which explained how to look for trends in mobile traffic to your website. Look forward to Part 3, "Act on your ROI", coming soon.

2. Give Your Reports More Dollar Power
Now that you know where your mobile trends stand (and hopefully it’s positive), make sure to analyze the data carefully. What does the trend signify and where do you want to go with the data?

After your CMO sees this amazing upward trend in mobile traffic (see the graph in the previous post), he will probably send the report to the CEO. The important question here is, can you show her the money? Surely, your CEO will be interested in how this trend impacts the company’s bottom line.

Again, check the Vistors->Mobile Devices report. This time, choose the Pie Graph version of the report to look at. You can pivot the table by Revenue if you are tracking E-Commerce or Goals with a monetary value. The report below graphs the revenue generated by mobile traffic segmented by mobile device.

Click to enlarge

Wow - iPad is bringing in the cash. This is highly actionable. You might want to ask yourself: is your site optimized for iPad? Is there a cross-promotional opportunity or coupon you can create with iPad?

And if you add up the total revenue from mobile devices, its more than $25k over the date range you're looking at. Let's say that's a week of data. Whatever you're paying to make your website ready for mobile, well, now you know - it's worth it.

If the $25K in revenue didn’t make analytics actionable, nothing else will. Your CEO can now easily connect the dots all the way to the bottom line.

Senin, 22 November 2010

Instant Preview issue resolved

Jumat, 19 November 2010

Web Analytics TV #14 - Just Wow

Well it’s another amazing episode of Web Analytics TV. In this exciting series with Avinash Kaushik and Nick Mihailovski, you ask and vote on your favorite web analytics questions via the Google Analytics Google Moderator site and we answer them.

In this episode we award Darren in Southern California the "Ninja of the Episode" award for his great question about how to track clicks on links that point to the same destination page. Really great question Darren. Just send us an email and we’ll send you an autographed, personalized, copy of Web Analytics 2.0.

Here is the list of last weeks questions. Just Wow!

In this action-packed episode we discuss:
  • (0:30) Tracking dynamic/variable goal values in Google Analytics
  • (1:50) How to determine if async ga.js has loaded for outbound link tracking
  • (4:00) How GA tracks sessions/visits with tabbed browsing
  • (6:38) Adding event tracking to links without a lot of manual work
  • (8:26) Best practices for passing campaign data via custom variables
  • (10:15) Is there a way to export data from an old profile to a new one?
  • (11:10) Ways to rollup data across accounts for custom dashboards
  • (12:20) In page analytics with sites that changes content very quickly
  • (13:30) Reasons why AdWords data in the API is a bit behind the other data
  • (14:40) Native call tracking with Google Analytics
  • (15:47) Why transaction and goal metrics might differ for the same page
  • (17:30) Ways to track different links on a page that point to the same destination
  • (20:18) Sharing advanced segments and custom reports with others
  • (21:12) How to link many AdWords accounts into Google Analytics
  • (21:50) Using autotagging to avoid AdWords-GA integration issues
  • (22:47) How many visits do you need to determine statistical significance
  • (25:10) How to track pay pal with Google Analytics
  • (26:20) How reliable are city level metrics in Google Analytics
  • (27:53) Good metrics to track the effectiveness of knowledge base articles


Here are the links to the topics we discuss:
As always, if you need help setting up Google Analytics or leveraging the advanced configuration options, we recommend hiring a Google Analytics Certified Partner.

If you found this post or video helpful, we'd love to hear your comments. Please share them via the comment form below. And, if you have a question you would like us to answer, please submit a question and vote for your favorite question in our public Google Moderator site. Avinash and I will answer your latest questions in a couple of weeks with yet another entertaining video.

Thanks!

Posted by Nick Mihailovski, Google Analytics Team

Jumat, 12 November 2010

Code Site In Five New Languages

Google Analytics is not only a product but also a platform, supporting an ecosystem of developers, tools, users, and partners. The Google Analytics APIs are an important part of this ecosystem and platform. In fact, over 80 new applications have been added to the Google Apps Gallery since we announced it 6 months ago. We love seeing this kind of innovation, and we want to do everything we can to encourage it -- not just in English-speaking regions, but around the world.

Today, I’m pleased to announce that we’re making an important development tool -- Google Code, the documentation on which developers depend to create these applications -- available in five additional languages: Brazilian Portuguese, Chinese (Simplified), Japanese, Russian, and Spanish. We’ve identified these languages as ones especially useful to users wanting in-language, technically involved documentation about Analytics.

Whether you are a long-time Analytics partner/developer in Brazil, a systems integrator in China, or a applications developer in Japan, you can now use Google Code in your native language.

To view the language of your choice, just go to http://code.google.com/apis/analytics and click on the language selector to the left of the Sign out link.

Happy reading, analyzing, and developing!

Kamis, 11 November 2010

Optimize And Analyze For Mobile, part 1

This is part 1 of a timely 3 part guest post on mobile analytics strategy and implementation by Feras Alhlou at E-Nor, a Certified Partner in Northern California. A must-read if you're preparing for the mobile revolution that has been going on for a few years. :-) There's still time - use these posts as a starting point.

Only a few years ago, organizations were still trying to figure out the web. Forward thinking marketers contemplated the capacity of the digital medium to implement viable online business strategies and maximize marketing ROI. Over time, marketing managers and business owners saw the writing on the, er, screen. Those who invested in their online presence and established a measurement culture are now reaping great benefits.


Whereas the web’s ROI has proved rewarding, the possibilities in “mobile” have yet to be discovered. Just taking a quick look at the ubiquitous use of smart devices (Google’s Android, iPhone, etc.) should pique your interest. And rest assured, you won’t stumble across any hidden fees and dropped calls in this market. Lucky for you (and me), it's not too early to start taking the mobile market seriously and by following these simple yet key steps, the ability to “rethink possible” is just a few Google Analytics metrics away.

With these posts, I hope to share a few useful tips for marketing managers and business owners to better understand their mobile traffic and improve returns.

Can’t get good reception? (Pun intended). No problem! Just apply these three analytics tips. The first one is here, and the other two will follow in blog posts in the coming weeks:

1. Look for Mobile Trends
The number of visits to your site might not be the most attractive key performance indicator (KPI). Yes, that's exactly what I am saying- more traffic does NOT always translate to more sales! In fact, I’ve seen plenty of sites with traffic through the roof and sales down the toilet. Instead, give your metrics more context and you’ll transform it from boring to sexy at twice the speed of light.

Here is an example: if I tell you that your month-over-month traffic is flat, well, that’s not very exciting (and you might want to have a serious talk with your demand generation manager). But if I tell you that, while your overall traffic was flat your mobile traffic has increased at a rate of 25%, it's a different story altogether. The graph below depicts this upward traffic trend.

So show some love to this KPI and monitor mobile traffic to your website. This can be easily done with Google Analytics by clicking on the “Mobile” reports under the “Visitors” Tab. Then, follow these action items to realize your true mobile trends, in context:

1.1 Set up an auto report to be sent to your inbox (daily, weekly or monthly)

1.2 If you are interested in monitoring specific thresholds, you can create a profile for mobile traffic and then create a custom alert that is emailed to you when these thresholds are met

1.3 Or, for the Ninja analyst, using the Google Analytics Data Export API & plug-in (e.g. shuffle point), pull this data automatically into your marketing dashboard

Note: You can still add more context to your metrics to determine how engaged your mobile visitors are. You can even trend it over time. This can be easily done by creating an advanced segment for the engagement metrics that are relative to your business (e.g. non-bouncing visits, visits with more than X minutes and viewed Y key pages, etc.)

(note: while the case study we're using is specific to an e-commerce business, the approach and analysis are applicable to all businesses, be it lead-generation or content or other business models. Also, for technical accuracy, the reports and analysis in these posts reflect users accessing your website from a high-end mobile device. Please see the technical note at the end of the posts on mobile sites as well as non-smart mobile devices).

Stay tuned for Part 2: Give Your Reports More Dollar Power, coming soon.


E-Nor

Senin, 08 November 2010

Take Advantage Of The Help Forum

Do you need answers to your Google Analytics questions? Do you want advice on customizing the tracking code? Eager to share your knowledge with other Google Analytics users?

The Google Analytics Help Forum is a community of people like you, who enjoy helping each other figure out the best ways to use Google Analytics. You can share your expertise or seek out answers in this user powered community. Also, there are active Googlers such as myself who are monitoring the forum and chiming in as often as we can. It's probably the quickest way to get help - usually you don't have to wait 24 hours for a response.

Our Top Contributors are highly knowledgeable and will point you to the right resources that'll help you troubleshoot your issue. We love giving them a shout out here - maybe next month it'll be you or someone who helped you.

Top Contributors for October
  • PPC_Guru (Phil Pearce)
  • Bronwyn Vourtis (Whims)
Thanks you two! Maybe we'll send you a little fun Google Analytics swag (or already have :-). And to everyone else writing responses and jumping in and helping out - thanks. And to those posting questions - thanks as well. It helps us figure out what's puzzling our users, or causing problems, so we can improve the product. This community never ceases to amaze us - you have driven improvements and refinements that make this product great. We're listening and evolving.

So, why wait when you have a question or a tip about GA? If you can't find the answer in our other resources such as the do-it-yourself resources under "Learning Center" over on the right hand side of this page, then go social and post them here in the forum.


Kamis, 04 November 2010

Major New Features Added To Intelligence

Today at Ad Tech NYC, we announced a few major new features in your Intelligence reports which should be very useful: Major Contributors for Custom Alerts, and SMS and Email alerts.

Major Contributors
When you have a custom alert set up to capture important changes in your account, you can now see a break down of the individual segments that are the most likely instigators of the change in traffic. For example, in the below screenshot we can see that on June 4, visits to the GoogleStore are up 510%. That alert was triggered because we set up a Custom Alert for "Visits Up By 10%".

(click to enlarge)

Now, as you can see underneath that Custom Alert there is a new sub-section called “Major Contributors.” When Google Analytics detects causes to a major change in traffic, this section will display up to 5 segments that have contributed to that particular change.

In this case, we see the source “gmail.blogspot.com” is sending new traffic to a particular landing page. You can click on the url of the referrer or landing page to view the path your users took to arrive at your site. It turns out that an article posted to the gmail blog is sending heavy traffic to the gmail sweatshirts on the GoogleStore. Digging in further, we also discover that it has resulted in an increase of 10 times the revenue for that day, which we can now attribute to a known cause thanks to this major contributor section.

That's Major Contributors!

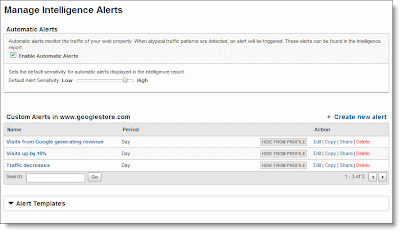
In order to use it, create a custom alert. Here's an image of the "Manage Intelligence Alerts" area in your reports:

And here's a help center article on examples of useful custom alerts, and you can also use the alert templates, pictured here, to quickly create custom alerts:


SMS and Email
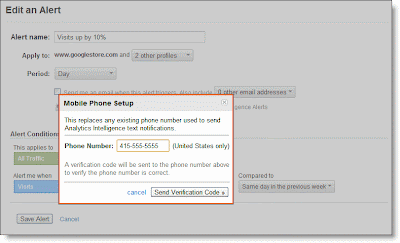
Also, when a custom alerts is triggered, you can now opt in to be notified by SMS (US only) or send alerts to your colleagues with multiple email recipients.

This is a practical feature when you've set up important alerts such as traffic or conversions down by 50%, for example. That's info you or someone in your organization should know ASAP, wherever you are.

And, as a reminder, you can get alerts on GA's full suite of metrics, including all 20 GA goals, Adwords metrics like CTR and content metrics like time on page.

This latest version of alerts with major contributors is a first for the analytics industry anywhere. We hope you enjoy it, and use it to take action quickly.


Rabu, 03 November 2010

System Update for November 2nd

On November 2nd, Google Analytics experienced technical difficulties, which lasted for a few hours. No data was lost, but users saw lower visits than expected during this time.

We deployed a fix as as soon as we were alerted and Analytics is now back to normal and data has been restored.