Late last year, we announced the ability to track Adobe Flash applications using Google Analytics. Flash tracking in Google Analytics provides the same features as standard JavaScript-based tracking, including campaign, pageview and event tracking. It can be used to track Flash content such as embedded videos, branded microsites and distributed widgets, including online games.
Since the launch of Flash tracking, we've seen some great projects that make use of the technology. We wanted to give a shout out to Matthew McNeely from InsideRIA, who has created a step-by-step tutorial on how to configure Flash tracking for your site. This tutorial is geared toward advanced users, covering everything from terminology to code configuration. If you have a Flash application you'd like to track, this is a great place to start.
For more detailed information on Flash tracking in Google Analytics, visit the Google Analytics Code Site. Have a great weekend!
Jumat, 27 Februari 2009
Reading
One of the most important skills we need to demonstrate is the ability to read and summarize complex information. The ability to communicate new ideas effectively to an audience can make you a valuable member of any organization. But it takes practice.
Like all of our work you need to think of the two questions: Who is my audience, and what do I need to say? For all of our summaries I ask that you write 50-100 words. Why? Because that is how we communicate now--in short messages. If you go to the front page of the New York Times or ESPN you will notice how these short blurbs are used to entice and attract readers. The ability to summarize is an essential component of web design.
Today's assignment is to choose ONE of the following articles and summarize it in your blog for your readers:
You will then learn how to put a clustrmap on your blog. Communication and Collaboration
is our 2nd standard. We use the clustrmap to collect data about how well our message gets out.
Like all of our work you need to think of the two questions: Who is my audience, and what do I need to say? For all of our summaries I ask that you write 50-100 words. Why? Because that is how we communicate now--in short messages. If you go to the front page of the New York Times or ESPN you will notice how these short blurbs are used to entice and attract readers. The ability to summarize is an essential component of web design.
Today's assignment is to choose ONE of the following articles and summarize it in your blog for your readers:
- Genius at Play: A listing of some Google tools from David Pogue.
- Athletic Scholarships: Expectations lose to Reality.
- Is Yellow the Next Green: Sewage is a serious problem. Interesting solution?
Be sure in your article to:
- Include a link to the original article. Find the correct link by clicking "Share" and copying the permalink.
- Keep your word count between 50-100 words.
- Title your entry effectively.
- Include your audience in your dicussion. Start a conversation so you get comments!
On a related note about "Bad things happen to ignorant people" you should all read this article before you decide what you post on your facebook account (or on someone else's!). Don't post, comment on, or upload anything unless you want it part of your public record forever. Also note that a professional image on these sites actually encouraged some people to get hired. You can use these sites to your advantage.
If you finish the blog posting and grading then move on to:You will then learn how to put a clustrmap on your blog. Communication and Collaboration
is our 2nd standard. We use the clustrmap to collect data about how well our message gets out.
- Go to the Get One page.
- Complete the form. Be sure to use the correct address for your blog. If you do not have an email to submit this will not work.
- The password will come to your email.
- Submit password on clustrmap page. They will then give you a long code that you copy.
- Go to your blog, log-in and open the control panel. Paste the long code in the About Me section.
- Submit new code. Wait for me to approve it.
You can also check out meez if you want to add an avatar to your site (which seems to be blocked at school right now...). You could also try voki.com. What image do you want to portray to the world?
Kamis, 26 Februari 2009
Grading Day
Today I hope to get your blogs up and running, but that might be different for each class. We will also grade our progress on that current project.
Web 2:
- Choose ONE of your projects.
- Create a folder in WDrive first initial-last name-project (bschneiderhobbies).
- Copy your project into this folder in WDrive.
- Copy folder to Udrive-WebSchneider-Web2-Hobbies/Sports.
- Answer the following questions: What is your site about? What went well in designing your site? Does your site demonstrate gender bias? Why or why not?
Web 3:
- You will do the ball tossing quiz in class.
- Save file and export movie as normal (bschneiderballtoss).
- Save it to Udrive-Webschneider-Web 4-Ball tossing when done.
Web 4:
- Be sure you have completed the first blog post and answered any comment questions.
- Blog post #2: List two major research sites about the movie subject. Where and how are you gathering information?
- Begin formulating a slogan, logo ideas, and storyboard. Some of you are using toondoo. How is it working?
- I am setting a 100 second limit on the movie.
Rabu, 25 Februari 2009
Google Analytics Videos From "Vacationland"
Back in December, we launched a YouTube Channel to make it easier to learn about Google Analytics. Now it looks like some users are giving us a run for our money! Rich Brooks of Portland, Maine has created a video series explaining how to use Google Analytics to enhance your online marketing efforts. Check it out.
- Google Analytics: How People are Behaving on your Site
- Where Does Your Traffic Come From?
- Using Google Analytics Filters for Better Traffic Reports
- The Google Analytics Dashboard
Selasa, 24 Februari 2009
How Many of Your Visits are from iPhones?
Advanced Segmentation is one of Google Analytics' most powerful features - you can use it to slice and dice your Google Analytics data by, well, pretty much anything. We've made it a little easier to see what your iPhone visitors are doing on your site by adding a default Advanced Segment showing just visits from iPhones.
Enabling the new iPhone segment is easy: click on the drop down menu at the top right of any report next to the text "Advanced Segments", and select "Visits from iPhones" in the list of default segments. You might want to turn off "All Visits" when viewing your iPhone segment; if the percentage of total visits to your site from the iPhone is small, it will be difficult to visualize the two sets on numbers on the same graph.

Like any Advanced Segment, all of Google Analytics' reports are available; this includes AdWords performance, of course. If you use AdWords, you can now use Analytics to better analyze the performance of any campaigns that use our new iPhone and high-end mobile targeting feature. We've added the iPhone segment to get you started, but you can always create a custom Advanced Segment to compare or combine iPhone visits with other mobile operating systems; for instance, if you're targeting ads in AdWords to iPhone & high end mobile devices (which currently includes Android devices), you can create a new segment for iPhone & Android.
From the Advanced Segments drop-down, click on "Create a new advanced segment", and create a segment with 2 criteria. Drag "Operating System" under the "Systems" dimension into the target area with the dotted-line border, and type "iPhone" into the "Value" field. Click "Add 'or' statement" to get a second target area, and do the same for Android. Then, you can name your segment "High-end mobile" and see that traffic in Analytics.
Happy Tuesday, and Happy Segmenting!
Enabling the new iPhone segment is easy: click on the drop down menu at the top right of any report next to the text "Advanced Segments", and select "Visits from iPhones" in the list of default segments. You might want to turn off "All Visits" when viewing your iPhone segment; if the percentage of total visits to your site from the iPhone is small, it will be difficult to visualize the two sets on numbers on the same graph.
Like any Advanced Segment, all of Google Analytics' reports are available; this includes AdWords performance, of course. If you use AdWords, you can now use Analytics to better analyze the performance of any campaigns that use our new iPhone and high-end mobile targeting feature. We've added the iPhone segment to get you started, but you can always create a custom Advanced Segment to compare or combine iPhone visits with other mobile operating systems; for instance, if you're targeting ads in AdWords to iPhone & high end mobile devices (which currently includes Android devices), you can create a new segment for iPhone & Android.
From the Advanced Segments drop-down, click on "Create a new advanced segment", and create a segment with 2 criteria. Drag "Operating System" under the "Systems" dimension into the target area with the dotted-line border, and type "iPhone" into the "Value" field. Click "Add 'or' statement" to get a second target area, and do the same for Android. Then, you can name your segment "High-end mobile" and see that traffic in Analytics.
Happy Tuesday, and Happy Segmenting!
Tuesday
We will continue our assignments today:
Web 2:
When you complete both sites please call me over to check them. Then continue the projects on page 2.93-2.94. You should work on the same two projects.
Web 3:
Continue to refine the walking man. Show me when done. If you complete it ahead of schedule work on a new walking man. Have him walking up stairs.
Web 4:
Please make your first blog post about the project: What productivity software did you choose? Why? Did you look at Zoho? What are the benefits or drawbacks of Zoho? Have you started to look at storyboarding software (toondoo? pixton? others??)
Senin, 23 Februari 2009
Monday Back to Basics: Accounts vs Profiles
These days, there are so many different uses for the word "accounts," and it's getting harder and harder to keep track of which definition is "in" or "out." The trend used to be to keep them for emailing or blogging, but now you can apparently use them to store a huge fortune solely for cats. See?
It can get quite confusing, which is why we’re not surprised that in January alone, over 14,000 people searched our Help Center to look up the difference between an account and a profile, two very important Analytics terms that have always remained a classic question for any analytics user.
The Difference Between an Account and a Profile
To put it simply, an account contains a collection of profiles. Note, if you have a simple website, you can probably get by without creating profiles. Profiles exist to let you do two important things.
Do
It can get quite confusing, which is why we’re not surprised that in January alone, over 14,000 people searched our Help Center to look up the difference between an account and a profile, two very important Analytics terms that have always remained a classic question for any analytics user.
The Difference Between an Account and a Profile
To put it simply, an account contains a collection of profiles. Note, if you have a simple website, you can probably get by without creating profiles. Profiles exist to let you do two important things.
- Separate out information about specific web properties, like your blog
In this analogy the account is the house and the profiles are the rooms. You want to know everything that's happening in the house, but you also want to do special analysis just on the living room. Maybe you have some people at your company who only care about one room. By creating a profile, you can restrict access for these people to just that room. - Apply different rules and criteria for advanced analysis
Here, you're using profiles like different lenses to look at your data. Maybe you need to do super-specific analysis on just new visitors in California. You can use a profile like a microscope to zero in on just that group of users. This type of advanced analysis can also be done using advanced segments.
Do
- Give each profile a different name so that it's easily identifiable (e.g. "Blog Only")
- Add the start date to the name of the profile so you'll always know how much data exists in the profile
- Give reports-only access to specific users for your profiles
- Create different filters for each profile so you can create different sets of data for different types of analysis
- Use the search box in the "top content" report to test filters on your profiles
- Filter out query parameters from your reports using profiles
- Talk to an authorized consultant about profiles if you have a complicated website and you're feeling unsure
- Neglect to create a master profile with all your original data for a website. This is really important!
- Give users "administrator" access for specific profiles. "Administrator" access is not profile-specific. This means administrators automatically get access to every profile in the account.
- Change settings on your profiles without keeping a log of changes. Otherwise things can get really confusing.
- Accounts vs Profiles in Depth (Code Site)
- Ten most common filters
- In-depth guide to creating profiles
- Excluding internal traffic from your reports
Jumat, 20 Februari 2009
Tracking Olly
Olly Hicks is attempting the ridiculous, the insane, the never-been-done. He is literally trying to row around the world. In a row boat. Alone. Well, he's mostly alone, but he's also bringing all of us with him by staying connected to the cloud and with the help of a handful of Google products. You can track his progress, read his blog, watch his videos, and even ask him a question at http://www.virginglobalrow.com. And Olly can see if anyone cares about his crazy adventure by checking out his Google Analytics reports.
So go visit his site and check out his progress. You'll notice that he's been stuck in a wind eddy and has been rowing around in circles for days and days. What a nut :) But we're with you Olly - go!
So go visit his site and check out his progress. You'll notice that he's been stuck in a wind eddy and has been rowing around in circles for days and days. What a nut :) But we're with you Olly - go!
Kamis, 19 Februari 2009
Rabu, 18 Februari 2009
Google Analytics helps Experience Project organize the human experience
To prepare for the case study on Experience Project, we explored www.experienceproject.com and pored through stories to better understand the user base and intent of the website. What we found was something akin to a directory of human experiences ranging from chronic illnesses to pet ownership. With over two million shared stories on thousands of topics, the website is both informative and addicting.
We sat down with Armen Berjikly of Experience Project to chat about his growing social experience website and usage of Google Analytics. Berjikly recounted a heartfelt story of a close friend diagnosed with multiple sclerosis and how Experience Project was built with the intent to connect people from all walks of life and share stories.
For Experience Project team, Google Analytics has proven to be an effective tool to help decide where and how to spend time, resources, and energy. To help refine the site, the team turned to Google Analytics for a variety of their website goals including:
Learning about Users
Google Analytics has helped Experience Project understand demographic, geographic, and subject matter information about their users. After uncovering search trends, the team created tools for managing personal challenges, goal achievements, and dream interpretations to meet increasing demands of their users.
Optimizing Advertising Revenue
As the site operates as a free service, maximizing advertising revenue is a key focus for Experience Project’s online marketing efforts. Through the Keywords Reports, Experience Project found that a large percentage of its members self-identified as dog and cat owners. Armed with this information, the team not only increased marketing on relevant keywords but also wooed pet-related advertisers with actual traffic and demographic metrics. To the delight of users, new functionality focused on pet ownership was built into the site.
Refining Product Development
Experience Project recently launched a new “Question and Answer” section on the site where users submit questions directly to the community. By using the Content Reports in Google Analytics, management and engineering can easily measure the success of the launch and user engagement. Key performance indicators include metrics on usage, return visits, and time spent on those pages which are all readily available.
By utilizing the growing feature set within Google Analytics, the management and engineering teams are able to make key product decisions and measure success. Simply put by Berjikly, “Google Analytics is easy to use, and it makes us more confident in our decisions.”
To learn more about how Experience Project leveraged Google Analytics, read the full case study.
Selasa, 17 Februari 2009
Two Cool Integrations: Telephone Leads & Live Chat
Today's post covers a more advanced topic, two low cost integrations with Google Analytics. The first is offline phone tracking, and the second is tracking live chat with your customers. Both integrations protect your account privacy - neither one involves submitting your login and password to these other services.
Tracking Calls to Unique Sales Phone Numbers
Mongoose Metrics supplies toll free numbers in bulk for extremely cheap in case you'd like to use unique phone numbers to track campaigns or even different product orders. Even better though, Mongoose has created a way to track these offline phone calls within Google Analytics. You can see the phone number called, as well as the duration and date of the call. You can also integrate this with an email alerts system for sales management.
The service works by provisioning a trackable number and assigning that number to a hidden web page on your site containing your Google Analytics tracking code. When a phone call to the tracking number is connected, the technology will place a web browser visit to your hidden tracking web page and in this way insert the phone call event back into your Google Analytics account. Each phone call generates a unique visit which is clearly labeled inside of Analytics, as you can see in this screenshot:
Example: Trackable Numbers and AdWords
Here's a practical example provided by Jeff Tirey, a VP at Mongoose Metrics. Imagine you manage the PPC campaigns for a mortgage broker. Your company purchases trackable numbers for use on Google AdWords campaign landing pages. The primary funnel for that campaign is the completion of a web form, which is tracked in Google Analytics. Currently, if a customer takes a secondary path by calling a phone number or browsing the rest of the site and then making a phone call, the data on that conversion is lost.
With Mongoose Metrics, the phone call conversion is preserved throughout the site via a cookie containing the unique trackable phone number. Mongoose Metrics provides the ability to correlate a PPC campaign to phone calls at a level of granularity determined by the campaign manager. It is possible to drill down, through Google Analytics, into campaign comparisons as well as keyword comparisons by mapping unique trackable numbers.
For more ideas on how to track offline conversions and the full impact of your website you can checkout this article by Avinash: Best Practices for Tracking Off-line Conversions.
Tracking Live Chat Interactions
LivePerson allows you to interact with your customers live via chat to offer real-time assistance and advice while a user is engaged with your website, a highly valuable service for helping customers, and also for learning about what their intention is. They created a robust integration with Google Analytics that is definitely worth a look. The integration shows you conversions after chat, and populates chat analytics data into a number of other reports, including
 (click to enlarge)
Regarding the integration, Philippe Lang, a VP at LivePerson, said, "Small and medium businesses want easy-to-use tools that demonstrate ROI so they can measure the success of their investments and maximize the efficiency of their marketing spend." For more information on LivePerson's integration with Google Analytics, please visit their integration page and check out this instruction PDF which shows info on set up and what reports will look like.
Disclaimer: While these two integrations make use of Google Analytics, they were created by third parties and are not officially supported by the Google Analytics team. For questions or support please contact Mongoose Metrics or LivePerson. We love seeing developers extend Analytics to make it more useful, so if you've done a cool integration or add-on, let us know with a comment!
Tracking Calls to Unique Sales Phone Numbers
Mongoose Metrics supplies toll free numbers in bulk for extremely cheap in case you'd like to use unique phone numbers to track campaigns or even different product orders. Even better though, Mongoose has created a way to track these offline phone calls within Google Analytics. You can see the phone number called, as well as the duration and date of the call. You can also integrate this with an email alerts system for sales management.
The service works by provisioning a trackable number and assigning that number to a hidden web page on your site containing your Google Analytics tracking code. When a phone call to the tracking number is connected, the technology will place a web browser visit to your hidden tracking web page and in this way insert the phone call event back into your Google Analytics account. Each phone call generates a unique visit which is clearly labeled inside of Analytics, as you can see in this screenshot:
Example: Trackable Numbers and AdWords

Here's a practical example provided by Jeff Tirey, a VP at Mongoose Metrics. Imagine you manage the PPC campaigns for a mortgage broker. Your company purchases trackable numbers for use on Google AdWords campaign landing pages. The primary funnel for that campaign is the completion of a web form, which is tracked in Google Analytics. Currently, if a customer takes a secondary path by calling a phone number or browsing the rest of the site and then making a phone call, the data on that conversion is lost.
With Mongoose Metrics, the phone call conversion is preserved throughout the site via a cookie containing the unique trackable phone number. Mongoose Metrics provides the ability to correlate a PPC campaign to phone calls at a level of granularity determined by the campaign manager. It is possible to drill down, through Google Analytics, into campaign comparisons as well as keyword comparisons by mapping unique trackable numbers.
For more ideas on how to track offline conversions and the full impact of your website you can checkout this article by Avinash: Best Practices for Tracking Off-line Conversions.
Tracking Live Chat Interactions
LivePerson allows you to interact with your customers live via chat to offer real-time assistance and advice while a user is engaged with your website, a highly valuable service for helping customers, and also for learning about what their intention is. They created a robust integration with Google Analytics that is definitely worth a look. The integration shows you conversions after chat, and populates chat analytics data into a number of other reports, including
- Map Overlay Report which displays volume and quality metrics of live chat interactions by geographic region
- Search Engines Report: Reveals the sources and keywords that drive interactive chats (and resulting conversions)
- Reverse Goal Path Report: Lists the navigation paths that lead to the most chats
 (click to enlarge)
Jumat, 13 Februari 2009
Introducing the Google Conversion Room Blog
Today we'd like to showcase a new blog run by our colleagues in Europe, the Google Conversion Room. Visit the Conversion Room for more tips on boosting sales, leads and conversion performance on your website using Google tools.
You can read about implementing and using Google Analytics, Website Optimizer and AdWords conversion tools. The blog highlights upcoming events and trainings in Europe and includes features from industry experts and guest bloggers.
Below we've highlighted a recent post that we think you'll find interesting. In it, Brian O'Sullivan, Google Analytics Specialist, talks about the importance of measuring Key Performance Indicators in Google Analytics to better measure and exceed your business objectives.
Why not sign up to the Conversion Room site feed so you don't miss out on any future posts! In the meantime, we'll try and give you some of the highlights here on the Google Analytics blog. For foreign language resources, you can also check out the French and Japanese versions of the Google Analytics blog
Rabu, 11 Februari 2009
Tips and Tools for Expanding Keywords Lists
You can use Google Analytics to find the best keywords and shift budget to the highest converting keywords, but what if you're looking to expand your keyword lists? In this post, we are going to look at how you can leverage other free Google tools to optimize your marketing campaigns beyond Google Analytics.
1) Take a look at the best performing keywords from your Google Analytics Keyword Report.

2) Input these keywords, along with your site's URL, into the Search-based Keyword Tool to find keywords not currently in your AdWords campaign. Suggestions from this tool are particularly useful because they're specific to the site and keywords you define, and are based on actual, past Google queries.

3) For each keyword identified, you can then use Google Insights for Search -- a tool that allows you to see trends in what the world is searching for -- to see where regional interest is highest and better optimize through geotargeting.  You can also enter your top-performing keywords from Google Analytics directly into Google Insights for Search to identify the top-related and rising searches. This can help you expand your keyword lists and keep them current by staying abreast of related search trends.
 These are just a few examples of how you can capitalize on the many Google tools available for improving your website ROI, so start expanding and optimizing your possibilities today!
1) Take a look at the best performing keywords from your Google Analytics Keyword Report.

2) Input these keywords, along with your site's URL, into the Search-based Keyword Tool to find keywords not currently in your AdWords campaign. Suggestions from this tool are particularly useful because they're specific to the site and keywords you define, and are based on actual, past Google queries.


Selasa, 10 Februari 2009
Mastering Motion Charts - Analyzing Spikes in Traffic
Quick Reminder: Tuesdays on the blog we'll be focusing on advanced topics. Today's topic relates to motion charts, one of the new enterprise features on Google Analytics.
Example: Spotting a spike in traffic using the Keywords Report
Spikes often deserve special attention when analyzing your site. They can indicate interesting developments in your industry, marketing impact or press coverage. Here are a couple of examples of situations that might cause a spike.
- The number of visits from a certain referrer, such as stumbleupon.com, suddenly jumps when a blog post gets attention
- Your conversion rate falls to zero because of an error in your signup form
- Your percentage of new visitors suddenly increases from an event sponsorship
- Your bounce rate spikes due to a redirect error
Navigate to the Motion Chart
To load the Motion Chart, start by navigating to the Keywords Report:

Click on "Visualize" across the top of the Report to load the Motion Chart:

Look for Sudden Movements
Next, press the play button. Here are two shots from Keywords Motion Chart on purevisibility.com, at different points in time:


In the second shot, we see an exception to the trend: on a single day in the period, the bubble for the keyword “pure visibility” moves to the very top of the chart.
Find the Cause of the Spike
What does this spike mean? On a basic level, it means more people came to your site from that keyword. A better question is "why did it occur" and "how can I get it to happen again?!"
Start by looking at your marketing & events calendar. Did any new advertising campaigns launch? Did an email go out or a conference occur? Next take a look at press coverage. Did any articles come out that day that might have drawn attention to this keyword? Did your competitors do anything significant?
In this example, it turns out that the high number of visits from the keyword "pure visibility" correlated with a local speaking event by a Pure Visibility employee.
Take Action
The company could use the information gained from using the Motion Chart in order to
- Calculate ROI on the speaking engagement
- Allocate more (or less) time and money to speaking engagements
- Start developing custom landing pages for each speaking engagement to generate more leads
- Set a conference schedule that maximizes ROI
- Focus on cases where significant movement is limited to a smaller number of the total bubbles. Sometimes, multiple bubbles in the chart move significantly. You might find yourself asking, are these spikes equally important? A general guideline you can use to assess the relative importance of spikes is to look at how much the other bubbles in the chart move. If all or most of the bubbles change position drastically throughout the time period, then the spikes probably aren't very important. If a single bubble moves drastically while the others stay in roughly the same regions, you might have found something interesting.
- Ask questions to find out what marketing and company events might help explain the trend. Related online (and offline) events are often the cause of traffic spikes from a segment. Keep a detailed schedule of the dates when new advertising campaigns are launched, whether paid search, TV, or print advertising. Keep track of corporate events, news, and press releases, and don't forget about events that may have impacted the industry at large.
- Look to other reports to confirm the trend. In cases where you observe a spike but aren't yet sure why, dig deeper using additional Google Analytics reports. Often, a spike in traffic from one segment will be reflected by spikes for the same dates in another report. Try comparing Keyword, Geographic Region, Traffic Sources, or Conversion data as you hunt for clues. For example, doing a Date Range comparison of the days directly before and after the spike might show us a similar spike in the traffic from a particular geographic region. Additional information like this might be enough to help explain the cause of the spike.
With a little practice, Motion Charts can become the backbone of all your visual analysis, saving you time and helping optimize your marketing campaigns. Check out some of the following resources for more information:
What events caused traffic spikes on your site? Any helpful tips for analyzing spikes?
Flash Test
You will create a music video and it is due Friday. I expect you to create something that demonstrates your knowledge of Flash, is creative, and gets done on time. This should be fun.
- You will use "Every Single Day". A copy is in the UDrive-WebSchneider-FlashMusic
- If your Flash is set to 12fps then each ten frames will equal one beat.
- You must include a Stop and Play button.
- Save both the .fla file and .swf file when done (bschneidermusic). Save both to Udrive when done.
- Everything else is up to you.
Flash continued...
Additional Flash assignments:
By the end of this week you must be able to:
- Create motion tween, shape tween and layers.
- Create simple buttons and simple action scripts.
Senin, 09 Februari 2009
Monday Back to Basics Series
Since the experts on the economy recommend taking a "back to basics" approach this year, we're going to take their advice literally and apply it to the Analytics blog. Every Monday our posts will focus on basic concepts, terms, tips and common questions. We hope it will help new users learn more about Analytics, while maximizing our long-time users' experience with the product.
For more advanced tutorials and concepts, be sure to check in on Tuesdays, where we'll cover both advanced analysis and advanced configurations. As for the rest of the week, we'll be mixing things up as always.
Monday: Check out the back to basics series for info on core concepts.
Monday: Check out the back to basics series for info on core concepts.
Tuesday: Read advanced topics that range from code customizations to case studies to features.
Wednesday/Thursday: We're keeping these days open for whatever's new and exciting.
Friday: Look for links to other great Google Analytics resources on the web, or read posts about business insights and Analytics by surprise guest writers.
New features and launches will always take precedence any day of the week! Looking forward to a busy 2009.
New features and launches will always take precedence any day of the week! Looking forward to a busy 2009.
Jumat, 06 Februari 2009
Urchin 6.5 is now available
After months of intensive development, we are excited to announce the release of Urchin 6.5, which contains a much asked-for new feature: AdWords integration. That's right -- Urchin can now automatically pull your AdWords cost-per-click data and integrate it into your reports, giving you the same kind of powerful search marketing analysis found in Google Analytics. No more manual downloading and processing!
How does it work?
Simple. Log in to Urchin 6.5, enter your AdWords account information and save it. Urchin will tap into the AdWords API on a daily basis, process your data, and build your reports. The cost data and ROI metrics you need to optimize your AdWords spend will be ready in Urchin anytime you need them.
Anything else new about Urchin 6.5?
Yes, there are lots of new features and bug fixes. Among these, Urchin 6.5 features improved geo-database functions, a improved configuration-manager utility, and updated Help Center articles. Urchin 6.5 also recognizes the latest browsers and platforms like Chrome and Android.
How do I get it?
As always, Urchin is exclusively licensed through our network of authorized distributors. The software itself, which can be run in demo-mode for up to 30 days, is available at www.urchin.com.
So, what is Urchin, again?
For those of you who grew up on Google Analytics (so to speak), Urchin is the run-it-yourself software-based version from which Google Analytics was originally born. The products are not identical, but are similar in scope and function. The primary differences are (1) Urchin runs on your own servers, so you keep all your data in-house, and (2) Urchin is not free -- it costs US$2995, which includes reporting for up to 1000 domains.
What's in Urchin's future?
More exciting features and an improved user interface, plus more ways to analyze your search engine marketing data. Stay tuned!
Assignments
Web 2 and Web 3:
Save your Flash documents in the WDrive. Save them in two formats. First save the Flash document as an .fla file. Then save the Flash Movie as a .swf file. Then you will have two files for each project. You can edit the .fla file. You watch the .swf file.
Please complete the following tutorials at a minimum by Monday:
Students who have those completed should work on:
Web 4:
Complete your second project today. I then ask you to analyze one of your projects in your blog. This is a serious analysis. Don't be afraid to include examples, links, and other tools. I expect you to take a full day for this writing. Really reflect on your work. Due Monday.
- Who is your intended audience? Why did you choose this audience?
- How does this project specifically target this audience?
- List three improvements you made from an earlier version and why you choose those improvements.
- Who has the funniest Flash in the Udrive? The coolest?
Kamis, 05 Februari 2009
Event Tracking Best Practices
Event Tracking is a feature of Google Analytics you use to track different actions visitors take on your website, such as clicking a button or downloading a file. It is useful for tracking actions on your website that don't take the user to a new page (such as clicking play on a video player).
Since we launched Event Tracking in October of 2007, we have made some changes to improve it. These changes aren't always captured in online tutorials, so we wanted to give an official update on Event Tracking best practices.
From "Double Call" to "Single Call"
After the initial launch of event tracking, we realized that the two-step process of implementing event tracking in Analytics could be simplified to a single call using the _trackEvent() method. In the initial version of event tracking, your implementation involved two steps:
To illustrate, suppose you have a video player that you want to track. In order for the player tracking to show up in your reports under the "Categories" section, you need to provide a category name. We'll use myVideos as an example. If the video has a "Pause" button that you want to track, we can accomplish this by attaching the following call to the "Pause" button on the video player for the Snoopy movie:
When users click the "Pause" button for the Snoopy movie, an event for that category/action combination is triggered.
If your movie player is Adobe Flash based and you use ActionScript 3, check out Google Analytics for Adobe Flash. It provides an intuitive environment for event tracking if you are an Adobe Flash developer.
Additional Resources
What do you use event tracking for?
Since we launched Event Tracking in October of 2007, we have made some changes to improve it. These changes aren't always captured in online tutorials, so we wanted to give an official update on Event Tracking best practices.
From "Double Call" to "Single Call"
After the initial launch of event tracking, we realized that the two-step process of implementing event tracking in Analytics could be simplified to a single call using the _trackEvent() method. In the initial version of event tracking, your implementation involved two steps:
- Setting up the object to track and giving it a name
- Tracking actions, labels, and values on that object using myObjectName._trackEvent(
action, label, value)
- Simply use pageTracker._trackEvent() to create a named category and track actions, labels, and values in one step, not two
- The term Objects was changed to Categories to better reflect the concept of tracking a category of page elements, such as "Video Player"
To illustrate, suppose you have a video player that you want to track. In order for the player tracking to show up in your reports under the "Categories" section, you need to provide a category name. We'll use myVideos as an example. If the video has a "Pause" button that you want to track, we can accomplish this by attaching the following call to the "Pause" button on the video player for the Snoopy movie:
pageTracker._trackEvent("myVideos", "Pause", "Snoopy");
When users click the "Pause" button for the Snoopy movie, an event for that category/action combination is triggered.
If your movie player is Adobe Flash based and you use ActionScript 3, check out Google Analytics for Adobe Flash. It provides an intuitive environment for event tracking if you are an Adobe Flash developer.
Additional Resources
What do you use event tracking for?
Rabu, 04 Februari 2009
Seminars for Success - San Jose & Denver: Get Trained!
San Jose, February 11, 12, 13
Are you attending Search Marketing Expo West in Santa Clara, CA? If so, here's a chance to acquire some hard skills as part of your trip to the conference. If not, you can still sign up for one or more days of professional Google Analytics and Website Optimizer training in San Jose.
If you’re a marketing professional, web designer, analyst, business owner or anything in between, these three courses will help you to efficiently measure and improve your online strategy.
Landing Page Testing with Google Website Optimizer - Wednesday, February 11
This hands-on course in Google Website Optimizer will take you through the process of testing your site to deliver an experience to your users that will take your conversion rates to new heights. Experts on Website Optimizer will present an overview, testing best practices, and then give you hands-on experience to better understand and run A/B/N and multivariate tests on your website and key landing pages.
Google Analytics – Introduction & User Training- Thursday, February 12
Are you new to the world of Google Analytics? Have you been using it for a while but have yet to really get beyond the dashboard? This course starts you off from the beginning with an overview of web analytics and by the end of the day you’ll have learned how to turn the sea of analytics data and reports into actionable information that can help drive your business decisions.
Google Analytics – Advanced Technical Implementation - Friday, February 13
If you already have the basics down and want to see what Google Analytics is really capable of, the advanced and technical implementation course is for you. This training is ideal for the tech-savvy, but equally valuable to those wanting to understand what’s possible. This course covers the inner workings of Google Analytics, configurations, filters and setups as well as advanced installs and implementations, new features and best practices.
Seats are limited, so register today!
Denver, Feb 24, 25, 26
Can't make it to the San Jose session? Try Denver instead.
Google Analytics – Introduction & User Training- Tuesday, February 24
Google Analytics gives you visibility into every aspect of how your website is used to accomplish the goals you had in mind when you designed it. The first of these three Seminars for Success courses will start you off with a high level overview of web analytics. By the time you leave you’ll be ready to take a mountain of data and endless reporting options and transform them into actionable information that can help drive your business decisions.
Google Analytics – Advanced Technical Implementation - Wednesday, February 25
After you have the basics down from day one or if you are already working with Google Analytics but want to know how to take it to the next level, the advanced and technical implementation course is for you. Day two of the Seminars for Success gets into the inner workings of Google Analytics, configurations, filters and setups as well as advanced installs and implementations, new features and best practices.
Landing Page Testing with Google Website Optimizer - Thursday, February 26
Your users are the reason you have a website. Google Website Optimizer is the tool you need to deliver an experience to them that will make your conversions take off. Experts on Website Optimizer will present an overview and testing best practices, and then give you hands-on experience to better understand and run A/B/N and multivariate tests on your website and key landing pages. This is invaluable information to see those conversions jump.
Seats are limited, so register today!
White House
As you know, the website for the White House was redone when Obama took office.
Read this cool analysis of the changes from the Boston Globe. This sounds a lot like the assignment we are doing right now. Can you make similar changes??
And here is a great example of story-telling from Christoph Niemann at the NY Times. Some of these lessons should certainly be applied to our websites and Flash documents. It tells so much about New York, but in a very unique way. When you tell a story you don't have to TELL A STORY to get your message across.
Selasa, 03 Februari 2009
Advanced Segments & E-Commerce
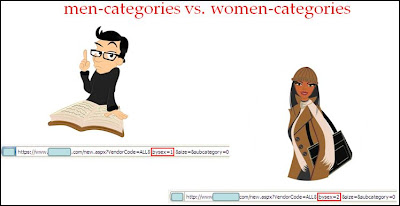
Imagine that you are the online marketing manager for a successful E-Commerce business. It is Friday afternoon and your CEO phones with a request. "I've seen our sales numbers, but I need more data. How many of our website visits and sales relate to men's products versus women's products?"
After considering it, you realize that this may not be so hard after all. All you need to do is:
Step 1 - Review your website URL structure
"Sure, I'll have it for you next week," you reply cheerily.
Your CEO almost sounds apologetic and explains that she needs the information tomorrow. "Of course," you reply, and hang up the phone wondering how you are going to pull this off.After considering it, you realize that this may not be so hard after all. All you need to do is:
- Find out if there is a unique URL identifier that distinguishes men's and women's products
- Create two advanced segments based on the unique URL identifier: one for men's products, and one for women's products
- Apply these segments to the reports to compare metrics/trends for each product category
Step 1 - Review your website URL structure

For this website, the men's product section and pages have an identifier called "bysex=1" in the URL, whereas the women's product section and pages have "bysex=2". You might want to double-check with your webmaster and/or web developer to identify all identifiers for each category. For this site, there are two additional identifiers, "CatID=1" and "men" as well as "CatID=2" and "women." Jot all this information down and then get ready to create your advanced segments.
Step 2 - Create Advanced Segments in Google Analytics

Within your Google Analytics report, click on one of the "Advanced Segment" links (see images below) and then click on the "Create a new advanced segment" link. If you need more details on the concept of segments and advanced segments, check out this video or read this post on how to create advanced segments.
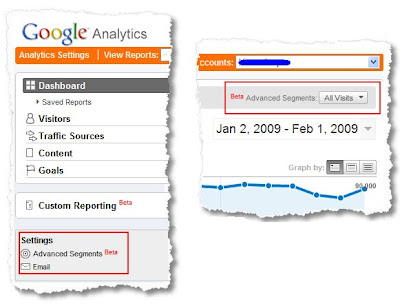

 In the above image, you'll see what information you need to create the advanced segments. You select the "Page" dimension, set the condition to "Contains" and set the value equal to the identifier you jotted down earlier. Since we had two more identifiers, you would want to include other pages that have these two identifiers, namely "CatID=1" and "men." You save this segment, give it a meaningful name such as MenCategory, and then create another segment for the women products category and use its identifiers, "bysex=2," "CatID=2" and "women," and follow the steps we used for the men's advanced segment.
Step 3 - Apply GA Advanced Segments and Analyze
After creating and saving your advanced segment, apply this new segment to your reports (by clicking on the "apply to report" link), and let the fun begin! 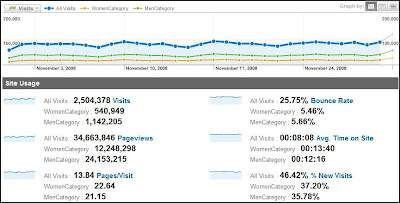
A few tips: apply the segments together so that you can compare (use the "Advanced Segments" dropdown in the top-right corner of your reports to apply segments). Here, we're comparing the All Visits segment (which is always selected by default) with the WomenCategory and MenCategory segments. While the results do not indicate if the visitor is a male or a female, the advanced segmentation provides insight into which clothing line category is currently driving more visits. You're now able to start some deep-dive analysis and provide some actionable insights to the CEO.
A few quick notes about your segments:
Additional Resources
Step 2 - Create Advanced Segments in Google Analytics
Within your Google Analytics report, click on one of the "Advanced Segment" links (see images below) and then click on the "Create a new advanced segment" link. If you need more details on the concept of segments and advanced segments, check out this video or read this post on how to create advanced segments.


Step 3 - Apply GA Advanced Segments and Analyze
After creating and saving your advanced segment, apply this new segment to your reports (by clicking on the "apply to report" link), and let the fun begin!

A few tips: apply the segments together so that you can compare (use the "Advanced Segments" dropdown in the top-right corner of your reports to apply segments). Here, we're comparing the All Visits segment (which is always selected by default) with the WomenCategory and MenCategory segments. While the results do not indicate if the visitor is a male or a female, the advanced segmentation provides insight into which clothing line category is currently driving more visits. You're now able to start some deep-dive analysis and provide some actionable insights to the CEO.
A few quick notes about your segments:
- The visits will never add up because the "all visits" segment includes visits to other categories and bounces off of the homepage.
- Similarly, the pageviews will not add up, because you could visit both the men's and women's categories in one visit or even visit neither category.
- You can see that the specific categories seem to be of more interest to the visitor. A much higher pages per visit, much lower bounce rate, and a higher average time on site. You could act on this by directing traffic (paid, banner, e-mail) to a specific category instead of dumping them on the home page.
- Such a large amount of traffic makes the site an excellent candidate for Google Website Optimizer!
Additional Resources
- A deeper look at Advanced Segmentation
- Introduction to Advanced Segments video
- Content Grouping in Google Analytics (for advanced users)
- Advanced Segmentation help topics
Senin, 02 Februari 2009
Bias, Usability, Accessibility, and Ethics
There are four main criteria that we use to assess the validity of a website; bias, usability, accessibility, and ethics. Today we will focus on bias.
This is also an exercise in communication skills and page design. Can you get your point across effectively? Do you know your audience?
1. Class Discussion about bias
This is also an exercise in communication skills and page design. Can you get your point across effectively? Do you know your audience?
1. Class Discussion about bias
2. Read the following articles:
Gender Bias
Journalism Bias this is a longer article. Skim the whole thing (except the studies and theories of media bias section). Click on links that interest you.
More on gender bias. Skim the comments--this is how a blog is different, there is a conversation/debate happening.
3. Create a one page flyer in Dreamweaver that contains bias.
Girls: Boys are silly. Why can't they act right so I can get my work done? They should treat us with respect and not be so clueless.
Boys: Girls are silly. Why can't they act right so I can get my work done? They should treat men with respect and not be so clueless.
Think about your audience. Who are you writing it for? I am looking for two things. First, do you have good ideas and understand bias? Second, can you format the page well so you communicate these ideas? This is your first task in design.
This flyer must include the following:
- A clip art or free-non-copyrighted image. Using copyrighted images is illegal. I can google it to check, so be careful. You could make your own image if you want using Paint or Fireworks. Check the links on the right for clip-art images or go here or to Flickr and use creative commons search.
- At least three quotes (from real or imaginary people)
- At least one link in the page. Choose the BEST link for your page and be able to support WHY you choose it.
- Have fun with this, stay respectful and appropriate.
Langganan:
Postingan (Atom)