Exams are due at the end of your designated exam period. Exams are worth 1/5 of your semester grade. Good luck!
Rabu, 14 Januari 2009
Selasa, 13 Januari 2009
Exam Prep
Tomorrow we will begin our exam. It is designed to take you about 2-3 hours of class time. Why do we have an exam?
1. Assess the students progress. Has the student mastered the skills required?
2. Assess the class/teacher progress. Has the class "missed" something? Does one class get it and the other doesn't? This is the data I analyze.
3. Compare this years class to previous years. Have the different methods and procedures I have used improved the class performance?
This is why I need everyone to take the exam and to do your best. I appreciate your effort and I am actually excited (believe it or not) to see what each of you produce.
Some reminders on what you need to be able to do (possible review points today??):
Internet Literacy:
1. Basic HTML set-up.
2. Insert images. Link pages. Create tables.
3. Create usable, accessible page.
4. Utilize basic tools (moviemaker, voki, google forms, etc...).
Web 2:
1. Create and manage a site.
2. Basic layout (without templates).
3. Insert images. Link pages. Create tables.
4. Create usable, accessible page.
5. Create citation page.
6. Create basic Flash documents.
7. Create an image map.
Web 3:
1. Create a basic Flash document.
2. Utilize buttons.
3. Insert sound.
4. Create usable, accessible page.
Senin, 12 Januari 2009
Blocked, Blocked, Blocked
I'm trying to figure out how to get the video to play. I thought it had been unblocked.
TED and Games
Theo Jansen: Freaky. Mind-blowing. But pay attention. What is life? Can you make something that lives out of PVC pipe? He does. Cyborg alert!
Wear your headphones.
When done check out the educational games and simulations. Can you find any other quality games?
- 3rD World Farming: Can you succeed as a farmer?
- 3D Architecture: Can you build a successful house.
- Tall Buildings: Super-cool site about tall buildings
- Power Play: Can you build a better mousetrap?
- Check out the Ayiti game.
- The Redistricting Game Can you rig your district?
- And finally we will review the game Darfur is Dying.
Kamis, 08 Januari 2009
Eyes on the Prize with Custom Reports
We've been taking an in-depth look at some of the new enterprise-class features that were recently launched in Google Analytics, and we're proud to present the next installment. This one relates to Custom Reports.
Custom Reports are like super reports. You can spend literally five minutes building one and feel like you've just built your own metrics dashboard. Building a tailored report is easy and it feels great! It means quicker access to the information you care about, less data overload, and easy sharing with colleagues. Let's dig into some of the details.
A few quick definitions
So, you're going to be building your report by columns and rows, just like a regular report. What do you want to put in the columns and rows? We've classified everything in Google Analytics in two ways: Metrics or Dimensions. In truth, you don't need to really understand the difference, because every data point is easy to find on the left of the custom report building screen. But a rich understanding always helps, so here's an explanation:
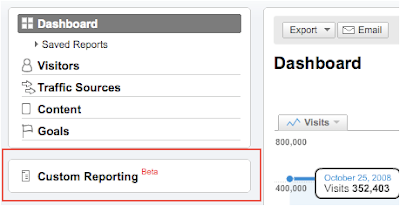
How to create a custom report
1) Navigate to the custom report page.
2) Build your report
We put together this video to give you step by step instructions on how to create your first custom report.
For more detailed instructions on how to build a report, visit the help center.
When to use custom reports
Custom reports are most useful when you have to combine metrics and dimensions that are not combined in other standard reports, or when you want to simplify an existing report by removing data that's not relevant. Here are some of the things that custom reports let you do.
You can choose any metric to build your custom report with. You also don't have to pair them with dimensions, which means there are no restrictions to which metrics you can use. However, when they are paired with dimensions, metrics are subject to certain restrictions. Please see this chart to understand which metric and dimension pairings are possible when designing a custom report.
Share your reports with the world
What do you use custom reports for? Send us an email and let us know! Be sure to send some screenshots. Happy reporting!
Custom Reports are like super reports. You can spend literally five minutes building one and feel like you've just built your own metrics dashboard. Building a tailored report is easy and it feels great! It means quicker access to the information you care about, less data overload, and easy sharing with colleagues. Let's dig into some of the details.
A few quick definitions
So, you're going to be building your report by columns and rows, just like a regular report. What do you want to put in the columns and rows? We've classified everything in Google Analytics in two ways: Metrics or Dimensions. In truth, you don't need to really understand the difference, because every data point is easy to find on the left of the custom report building screen. But a rich understanding always helps, so here's an explanation:
Metric (columns)
Dimension (rows)
How to create a custom report
1) Navigate to the custom report page.

2) Build your report
We put together this video to give you step by step instructions on how to create your first custom report.
For more detailed instructions on how to build a report, visit the help center.
When to use custom reports
Custom reports are most useful when you have to combine metrics and dimensions that are not combined in other standard reports, or when you want to simplify an existing report by removing data that's not relevant. Here are some of the things that custom reports let you do.
- COMBINE METRICS FROM MULTIPLE REPORTS - Custom Reports let you group together whichever metrics and dimensions you find most relevant. This lets you go beyond standard reports to compare data from multiple areas of GA all in one place. This means less switching from one report to another and more flexibility in how you analyze your data.
Example: An outdoor sporting goods store places a heavy emphasis on paid search to drive e-commerce transactions, and uses the AdWords Campaigns report often. When it comes time to share reports among their internal teams, they currently do multiple exports in order to incorporate metrics from the Site Usage, E-Commerce and Clicks tabs all in one view. With custom reports, however, they can drag and drop the metrics they'd like to see from each tab and perform a single export into Excel in order to share their data with team members.
- CREATE RELEVANT DRILLDOWNS - By making use of multiple sub-dimensions in custom reports, you can create a report that drills down up to five levels deep, in whatever order you choose. This lets you easily break visitor behavior into workable segments, with more precision than ever.
Example: Cross Country Inc., a major transportation and logistics company, uses Google Analytics to track advertising campaigns spanning many channels including print ads, banners and pay-per-click ads. For the sake of consistency, Cross Country has chosen to use one universal campaign name, "TruckerRecruitment," that includes six unique acquisition channels (PPC, Print Ads, Banner Ads etc.)
The agency managing the placement and measurement of these recruitment ads needs to report back to Cross Country's management team on their performance, but when they navigate to the "Campaigns" report, they can only drill down one level (done by choosing a value in the "dimension" dropdown).
But wait! By using custom reports, the agency can now arrange drilldowns up to five levels deep, in whatever order they choose. This now makes it easy to show Cross Country how their Spanish-language print ads in Los Angeles did vs their Spanish-language banner ads in Chicago and optimize their spend accordingly.

- SIMPLIFY REPORTS TO SHARE WITH COLLEAGUES - If you need to share data with teammates that may not work closely with Google Analytics, you can use the tab feature in custom reports to create specific tabs for individual people or job functions. This lets your colleagues see only the data relevant to their activities and helps cut down on confusion and data-overload.Example: National Pizza has a wide range of online marketing campaigns that it uses Google Analytics to track and monitor. Several people within the organization regularly log in to Google Analytics in order to check on the performance of different campaigns. Now the webmaster can create a custom report with one tab for each of her colleagues. Each colleague gets a custom view with only the data relevant to his or her activities.


You can choose any metric to build your custom report with. You also don't have to pair them with dimensions, which means there are no restrictions to which metrics you can use. However, when they are paired with dimensions, metrics are subject to certain restrictions. Please see this chart to understand which metric and dimension pairings are possible when designing a custom report.
Share your reports with the world
What do you use custom reports for? Send us an email and let us know! Be sure to send some screenshots. Happy reporting!
Scramble
I am scrambling to get things done. I am moving fast on exam information and will have that tomorrow. I have to eliminate one component because of the time we have missed. I also need to have all of your grades. Several of you have not turned in a project (all grades posted on Edline). Last chance.
The importance of being able to write a coherent memo cannot be overstated. Today we will focus on the one page memo. You must be able to synthesize ideas and summarize them in a format easily read by both bosses and colleagues. This takes practice. A lot of practice.
The topic today might seem a bit odd; its you! I want you to write this memo to yourself. The topic? What skills must you learn in order to be competitive, productive, and happy in the 21st century world?
Be sure to follow the format and really, really organize your thoughts (Someone will ask--how long is the one page memo?) Post to blog when done. This is your final assignment. If you don't finish today please submit tonight for homework as we will probably start the exam work tomorrow.
Senin, 05 Januari 2009
GAAC Attack: Year-End Fun for Google Analytics Pros
2008 was an amazing year for the Google Analytics Authorized Consultants (GAACs). These guys are experts with Google Analytics, providing excellent service in areas such as installation, consultation and training. They're located all across the US, which means you can probably find one near you.
We really like hearing from GAACs because they eat, live and breathe GA every day. Once a year, we invite them to Google for an event called the Google Analytics and Website Optimizer Authorized Consultant Summit (GAAWOACS for short... just kidding). This past December over 200 participants from more than 30 countries attended. Vint Cerf keynoted and we had four days full of product information on Google Analytics, Website Optimizer and Urchin delivered by our Product Management team, plus case studies, networking and oh yeah.. lots of food and drinks.

We're not sure who looks forward to it more, the Authorized Consultants or us, but it's clear something's going right when a participant produces a rap about the event! Cheers to Paul Chastain from Just1 a Google Analytics Authorized Consulting company out of Idaho.
Here is the rap. I promised him glory since we're all out of T-shirts. Hope to see more like this next year!
Langganan:
Postingan (Atom)